
April 3rd, 2026
business
investments
Our latest visualization illustrates how much it would cost to open one of these franchises based on initial investment requirements.

April 3rd, 2026
business
Are U.S. banks too big to fail? And how many “big banks” are there really? Our visualization lets you easily compare the size of different banks according to the value of their assets.

April 3rd, 2026
business
investments
2019 is shaping up to be a major year for companies to go public, but is it worth getting in on the action? Absolutely, if you’re lucky or smart enough to pick some great companies.

April 3rd, 2026
business
Private fintech companies mean big business, and right now they’re growing in size. Our visualization breaks down the companies and industries getting the most money from investors

April 3rd, 2026
business
Factory jobs are on the comeback, but the best manufacturing companies aren’t always profitable. Our visualization breaks down the top 50 American producers across industries, highlighting the ones with the most revenue and highest profit margins.

April 3rd, 2026
business
The largest companies in the world have massive R&D budgets, but not everyone is investing in innovation at the same rate. Our visualization breaks down the top 50 leaders by industry category.

April 3rd, 2026
business
It’s no secret tech companies dominate the marketplace today, but do you know which regions and industries produce the most winners? Our newest visualization analyzes the top 50 tech companies in the world.

April 3rd, 2026
business
We partnered with Brand Finance to create a new map highlighting the strongest and most valuable retail brands. The results indicate which companies (and countries) are dominating one of the most competitive industries in the world.

April 3rd, 2026
business
trade
Most people drink coffee every single day, but do you know where that morning buzz ultimately comes from? Our new map breaks down the entire global market of coffee exports in one easy-to-understand visualization.
April 3rd, 2026
business
investments
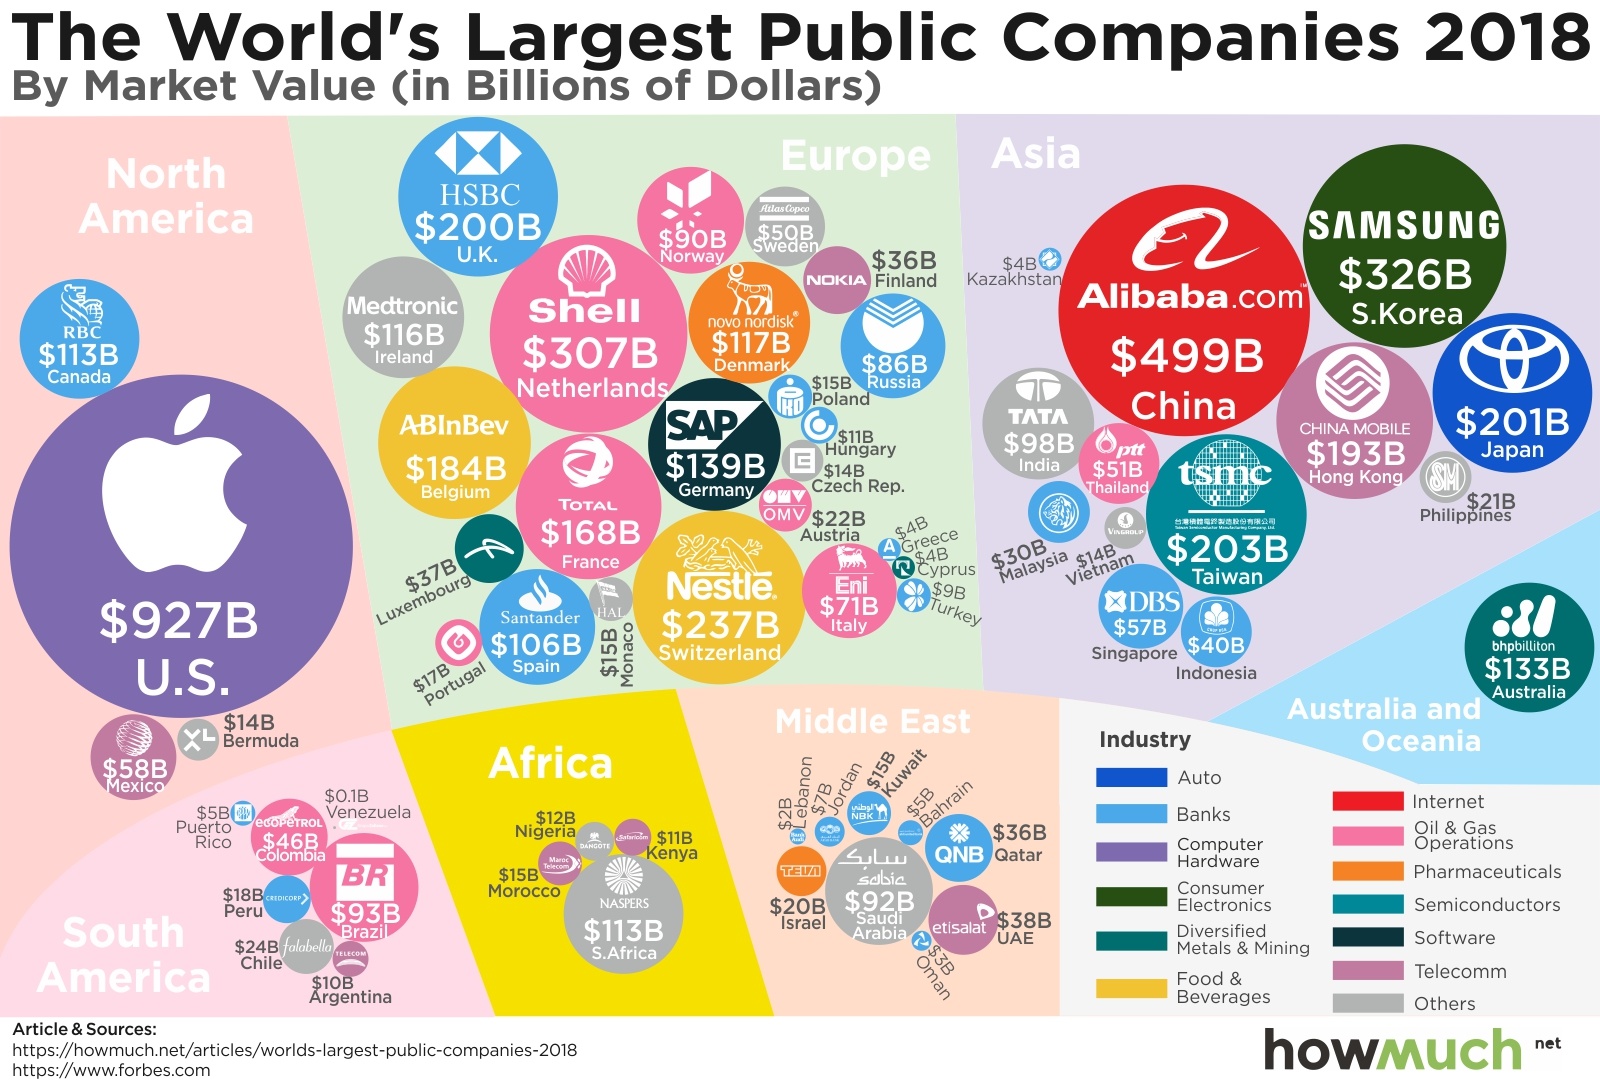
Apple’s market cap is insanely high, but how does it compare to companies around the world? Our new visualization brings a fresh perspective on the most valuable companies in the global economy.