
April 3rd, 2026
Personal Finance
debt
U.S. national and consumer debt is reaching unprecedented heights. Take a look at how each state is being impacted by the current United States debt crisis.
April 3rd, 2026
The Economy
debt
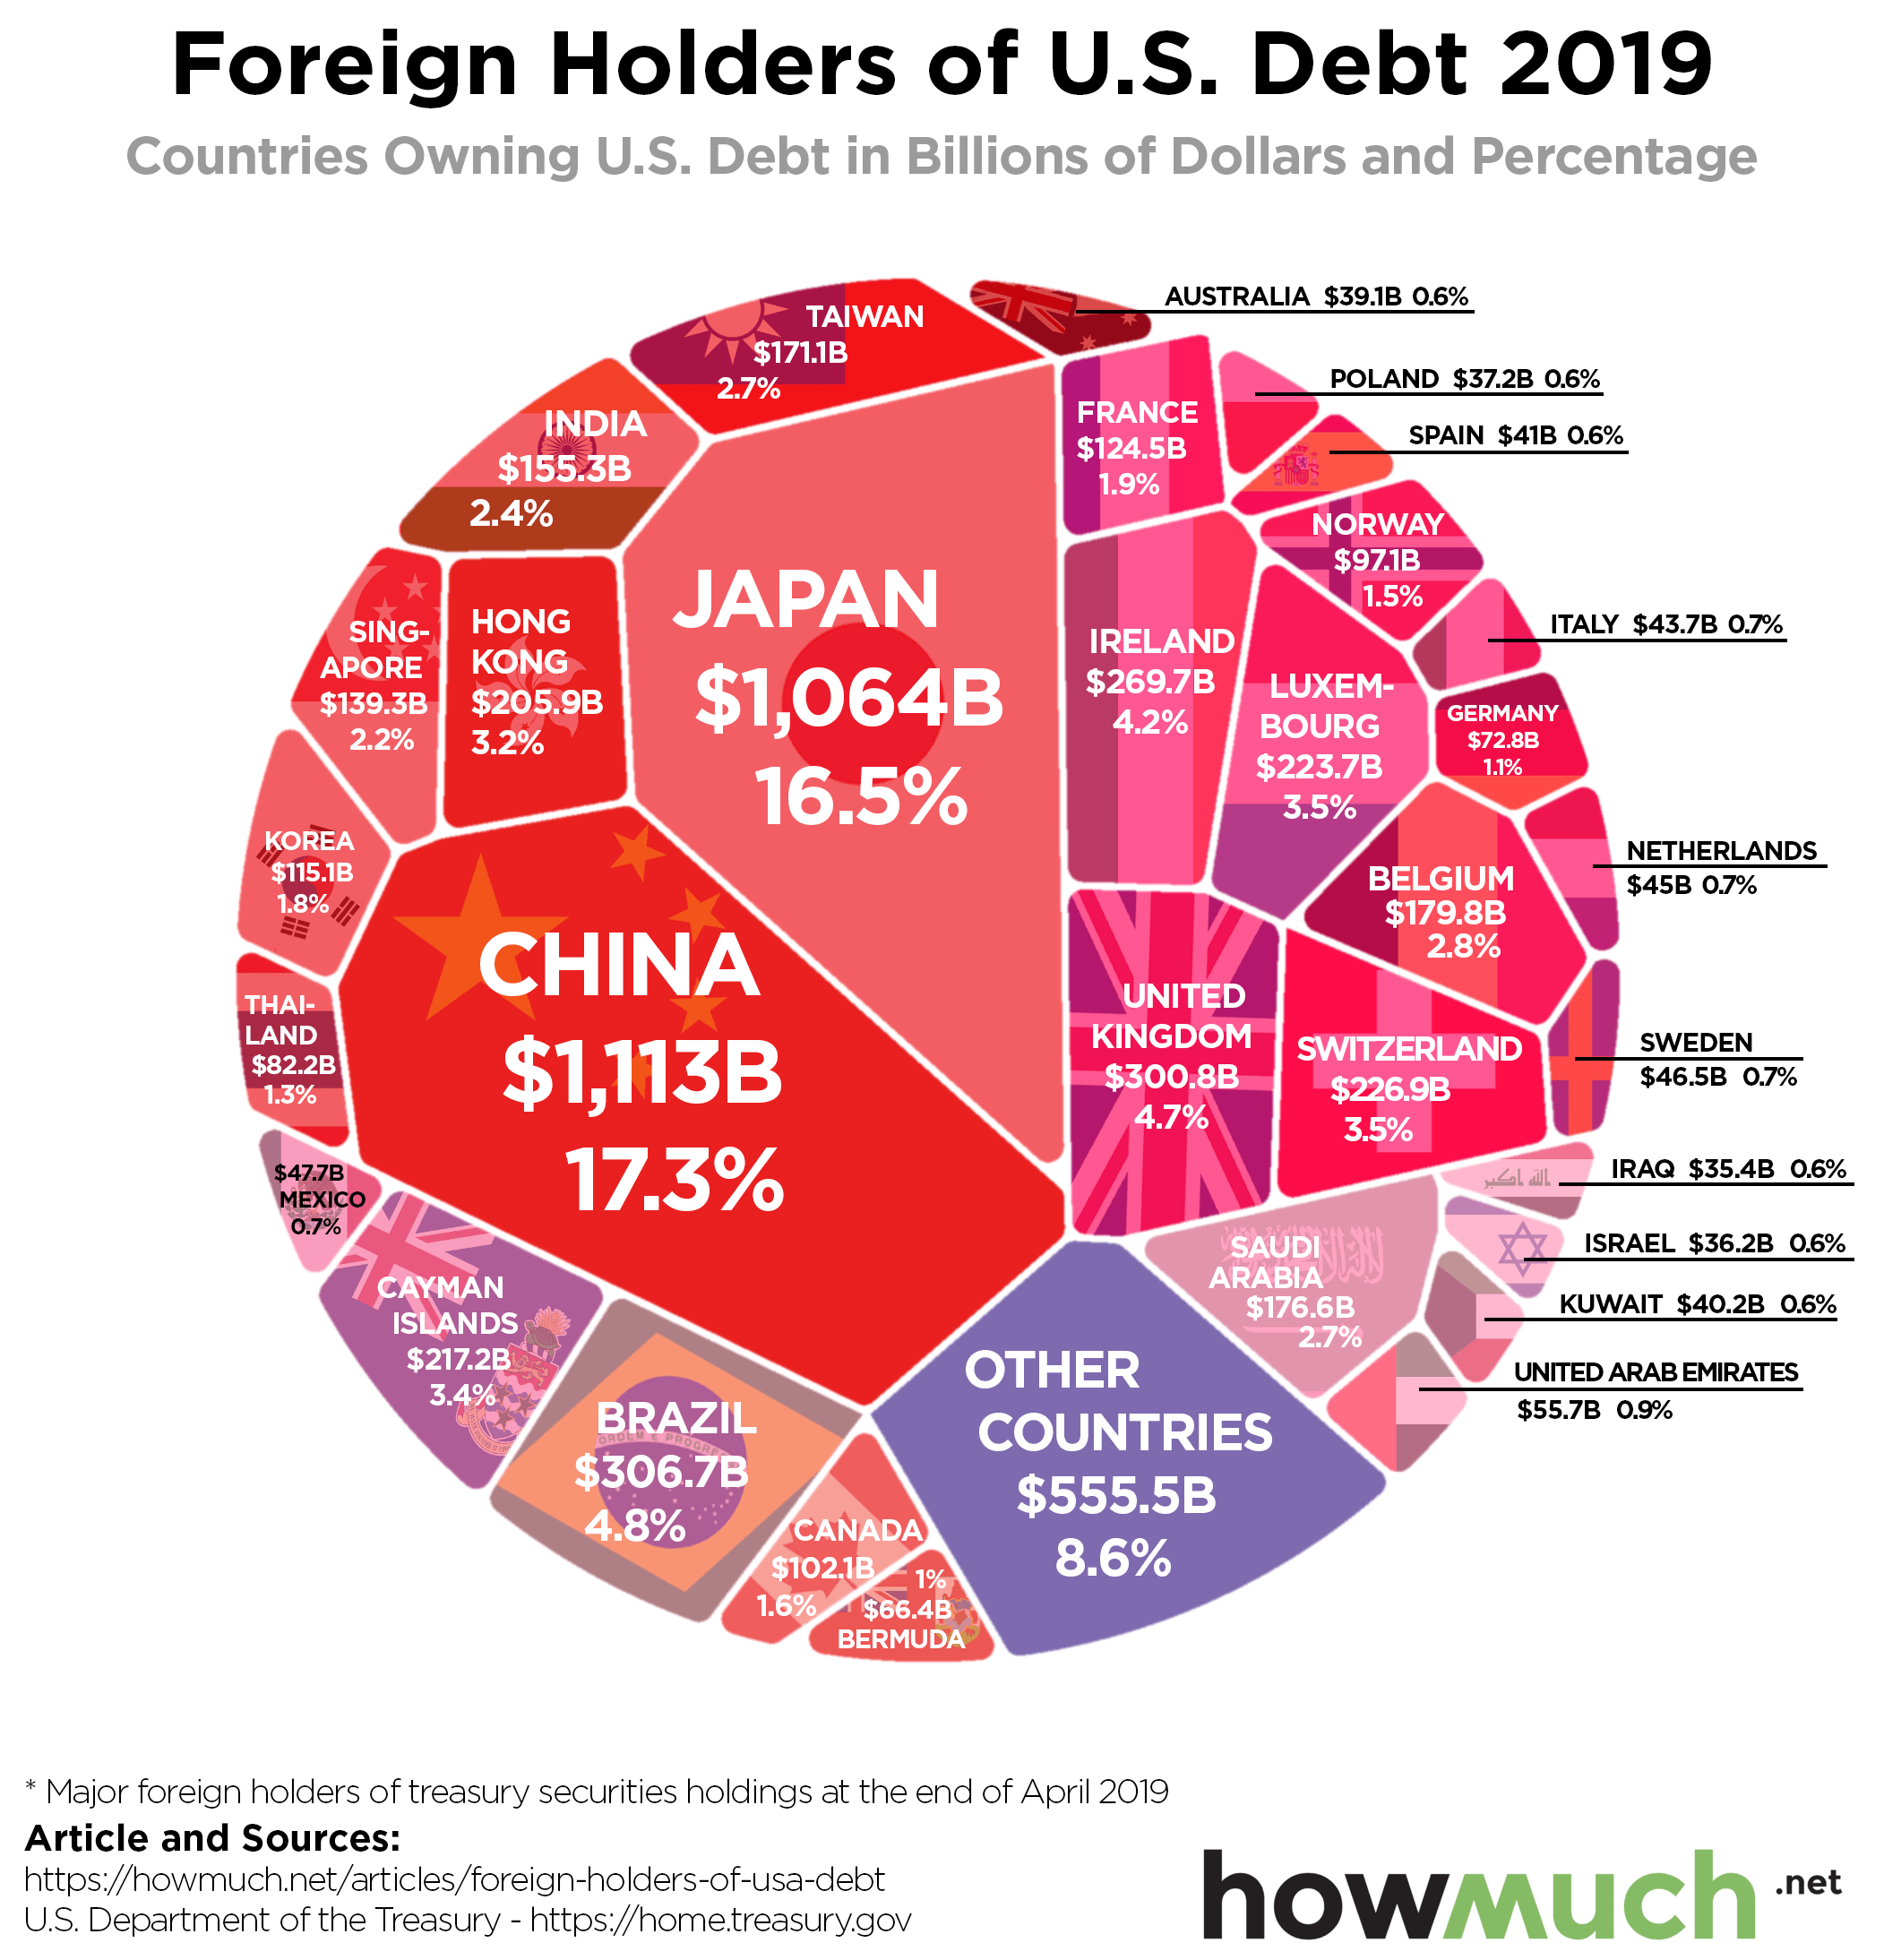
The U.S. government borrows money by issuing treasury securities, many of which are held by foreign countries. Here’s a breakdown of which foreign countries own the most U.S. debt
April 3rd, 2026
The Economy
debt
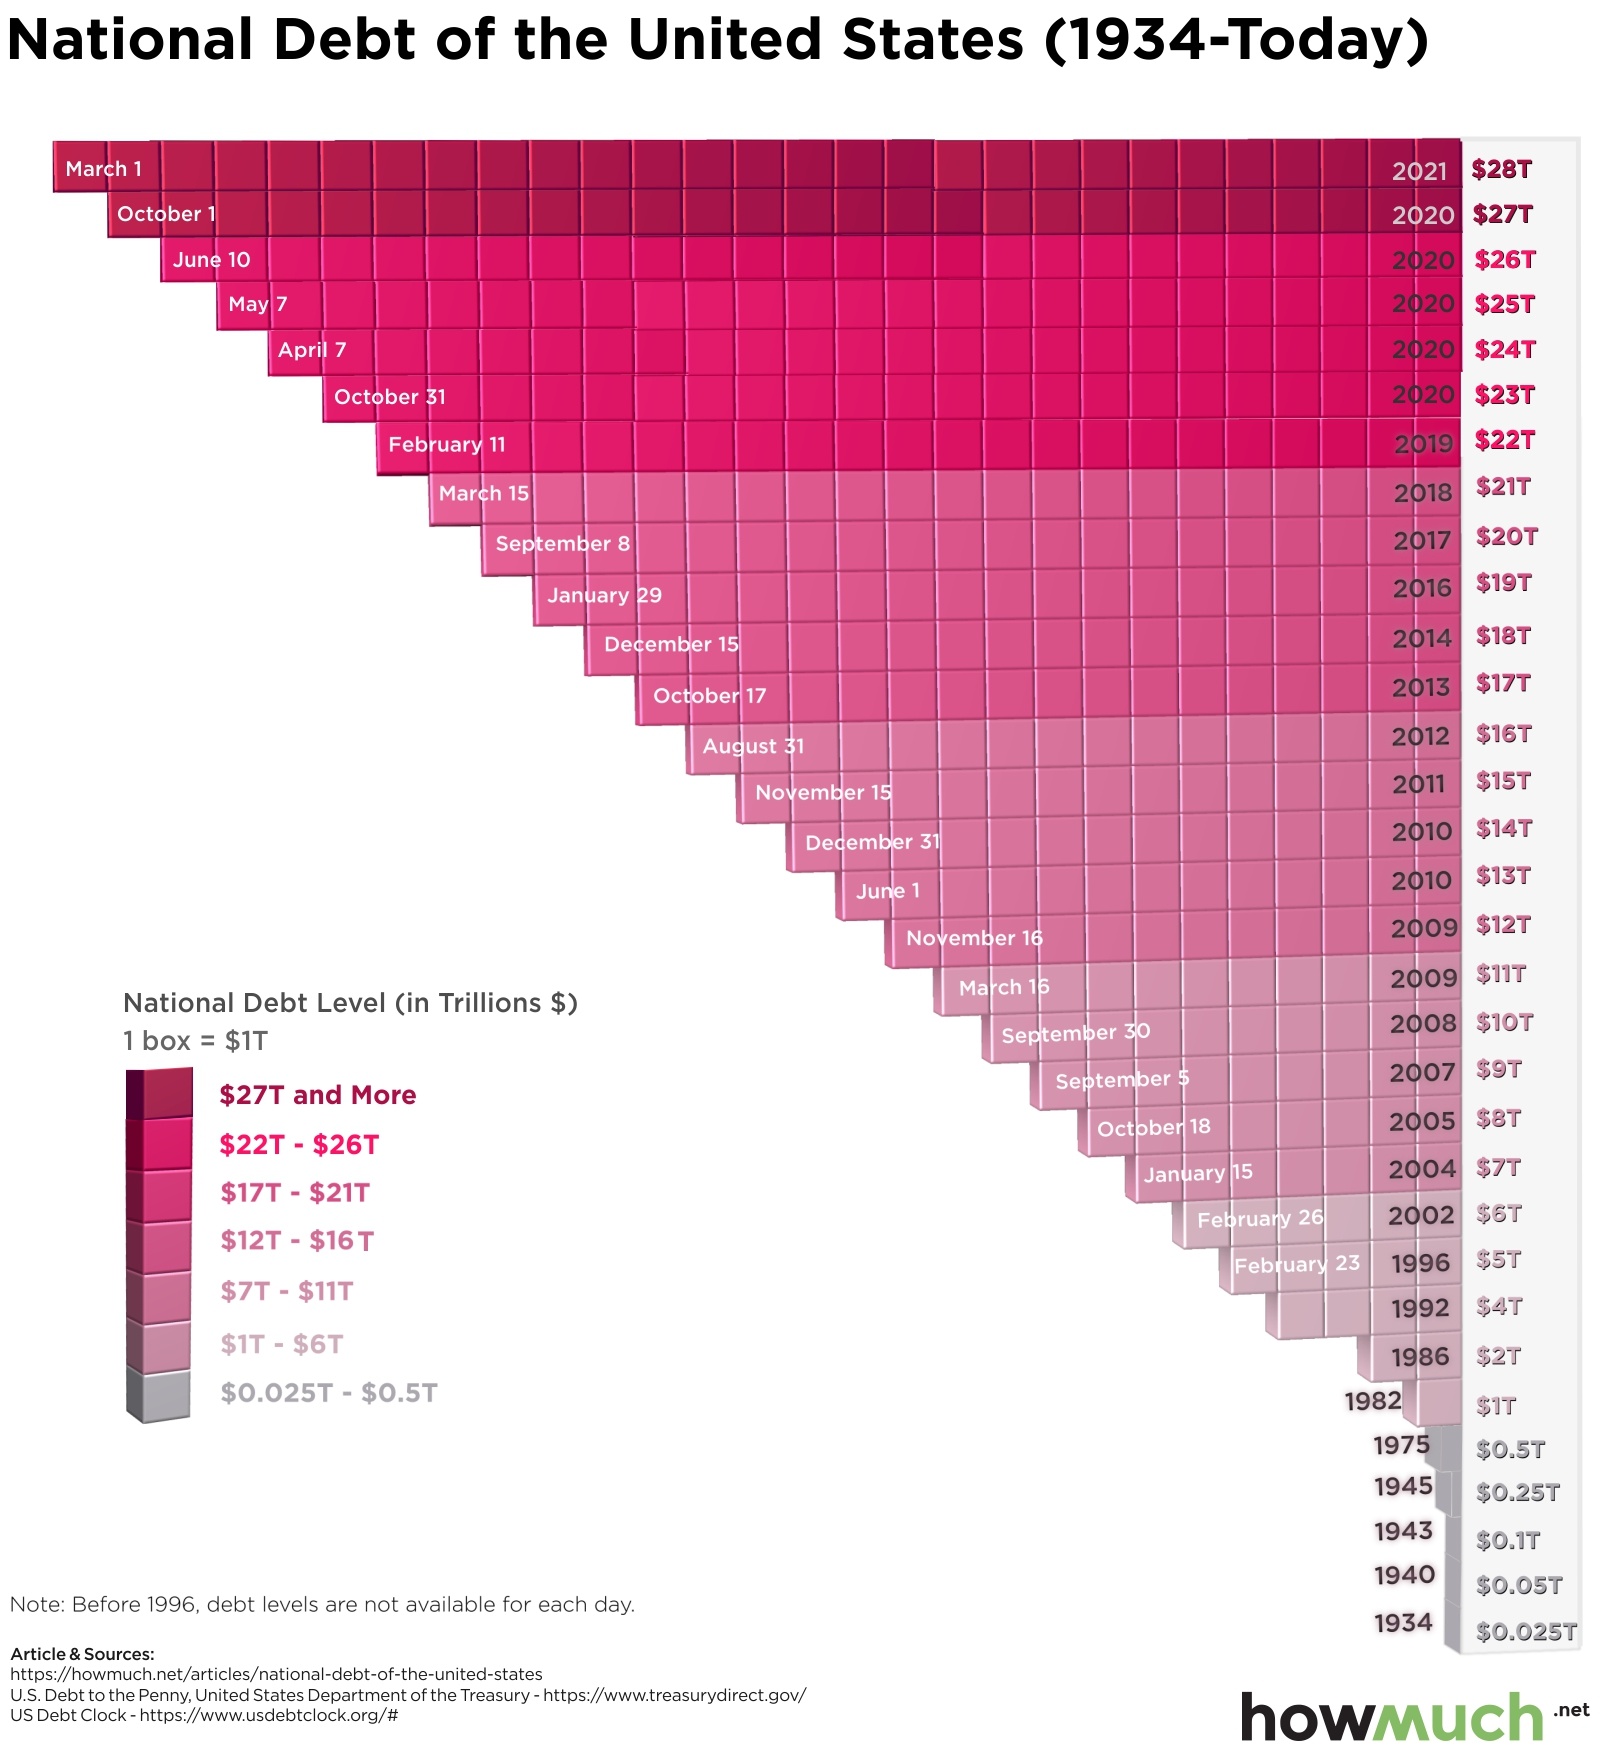
Balancing the government checkbook has gotten increasingly complicated over the years

April 3rd, 2026
Real Estate
debt
What is one of the main factors in how much to budget for your monthly mortgage payment? Location, location, location.

April 3rd, 2026
Personal Finance
Real Estate
debt
investments
Not sure if homeownership is attainable for you in the future? In a lot of states, renting might be the cheaper option anyway.
April 3rd, 2026
The Economy
debt
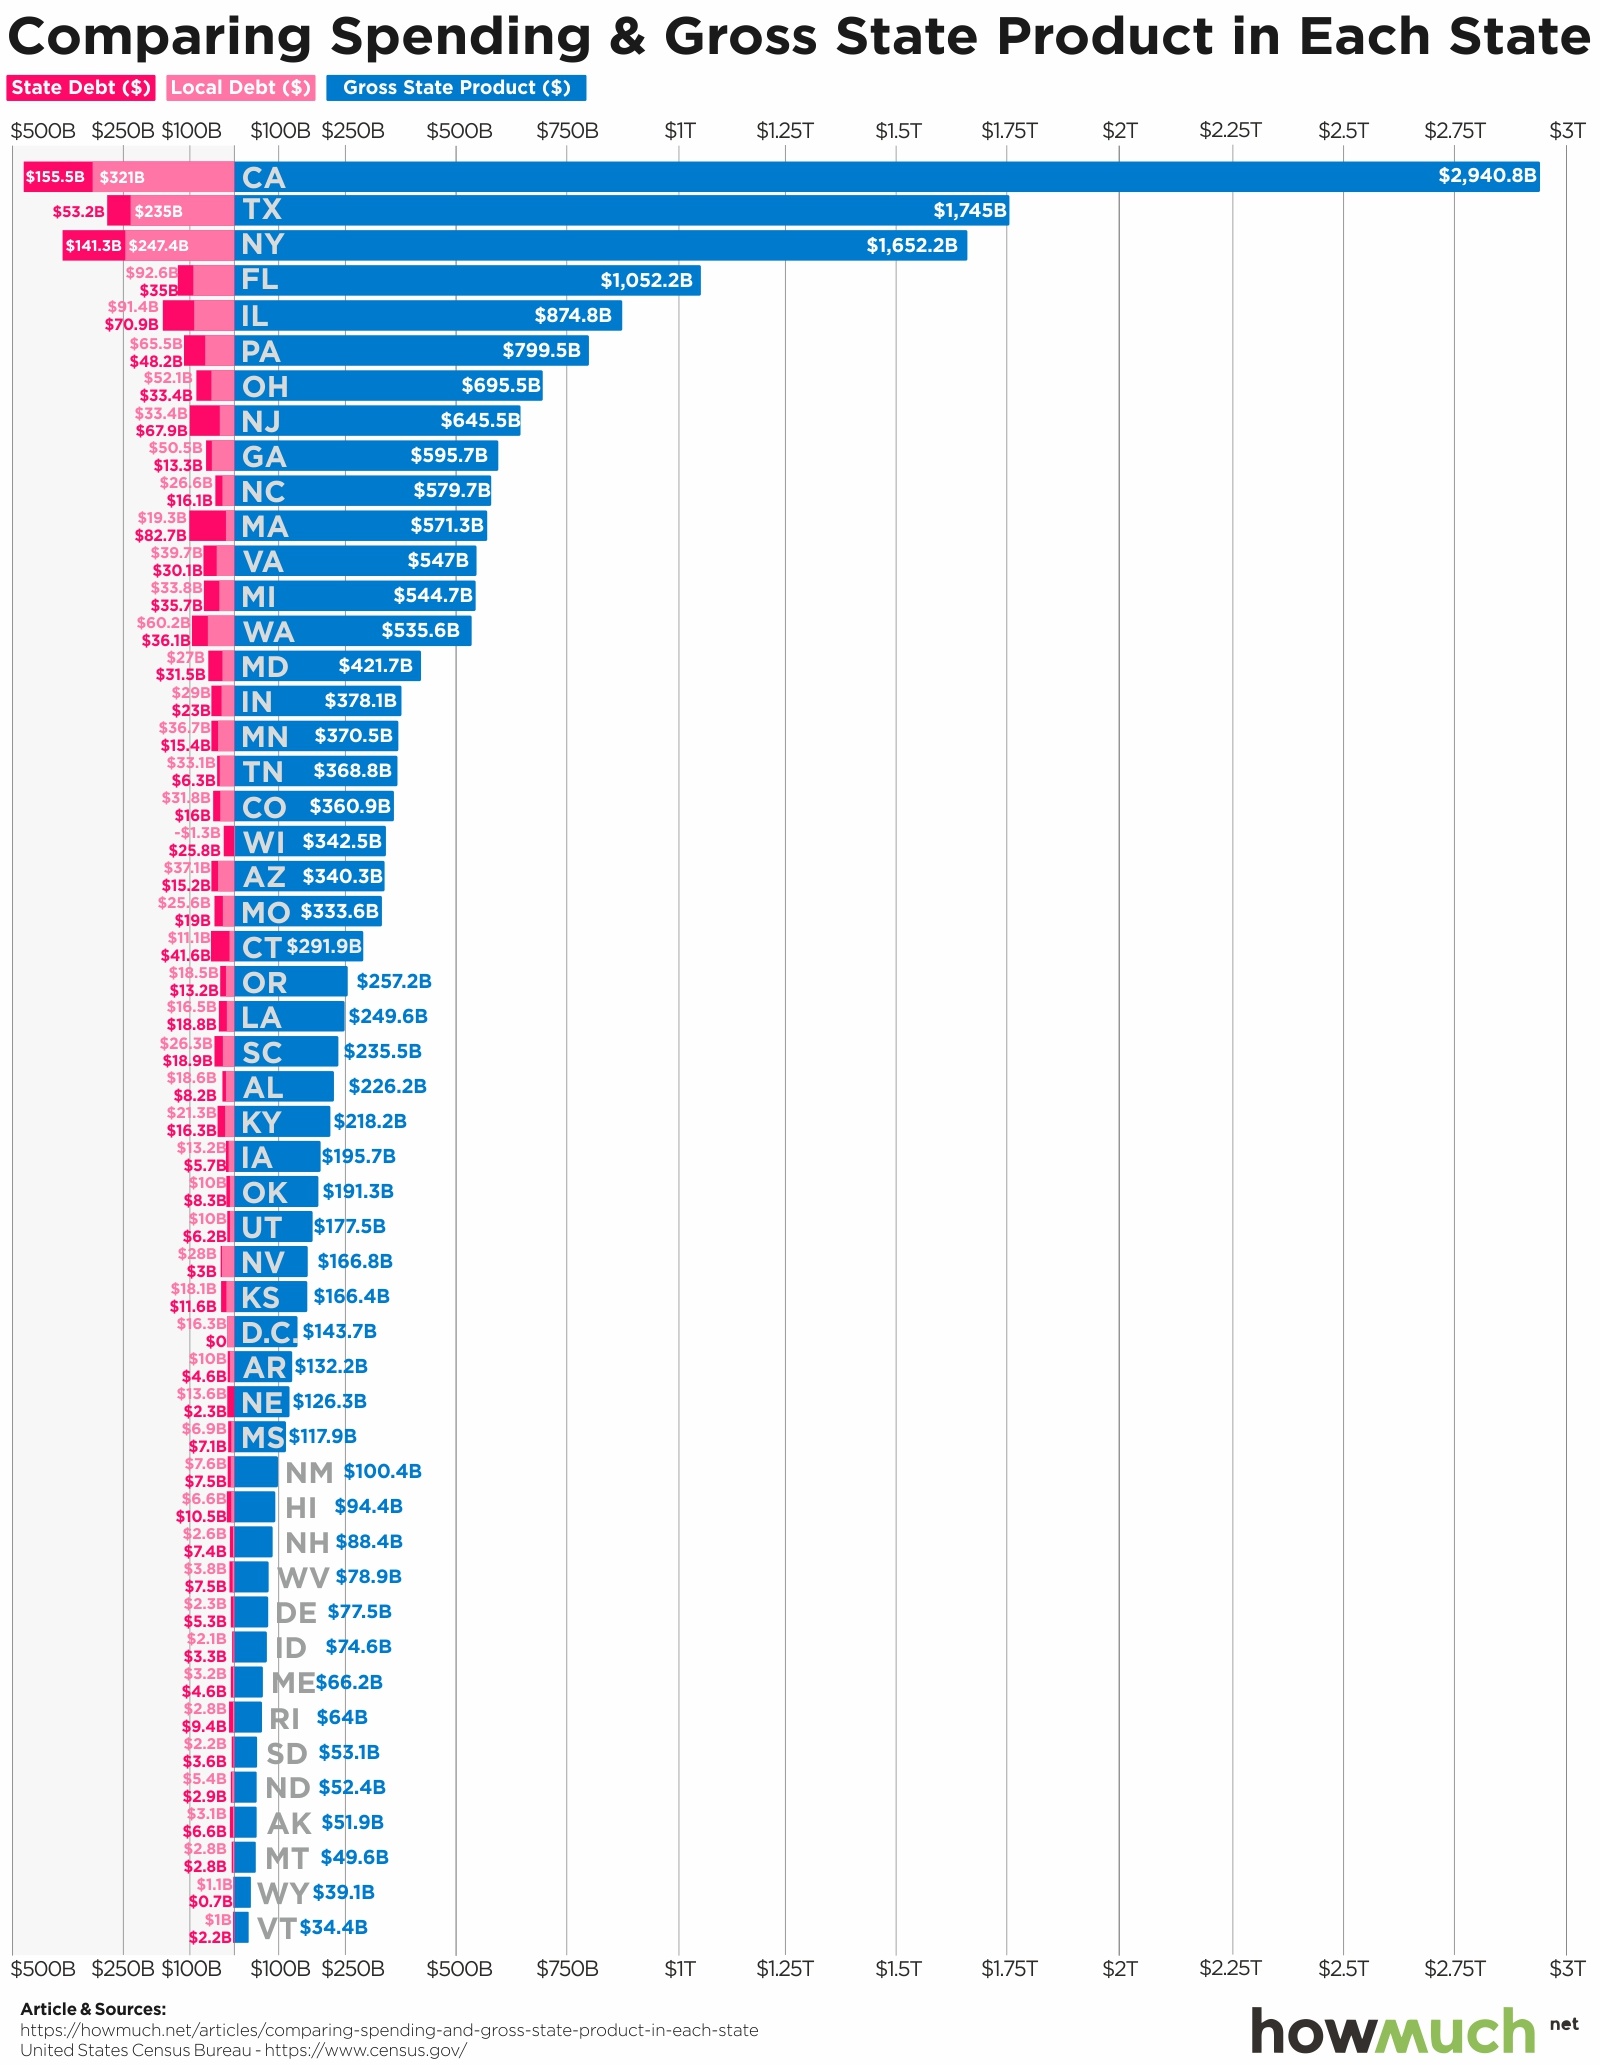
Our latest visualization uses data from the U.S. Census Bureau to compare each U.S. state’s debt to its output

April 3rd, 2026
Personal Finance
debt
Unsecured personal loans are on the rise in the U.S., but do you know how people are using the money? Our visualization lets you see the most common reasons people take on this type of debt

April 3rd, 2026
Personal Finance
debt
Americans have taken on over $1 trillion in total credit card debt. Our map shows how long it will take the average borrower in every state to pay it all back.
April 3rd, 2026
The Economy
debt
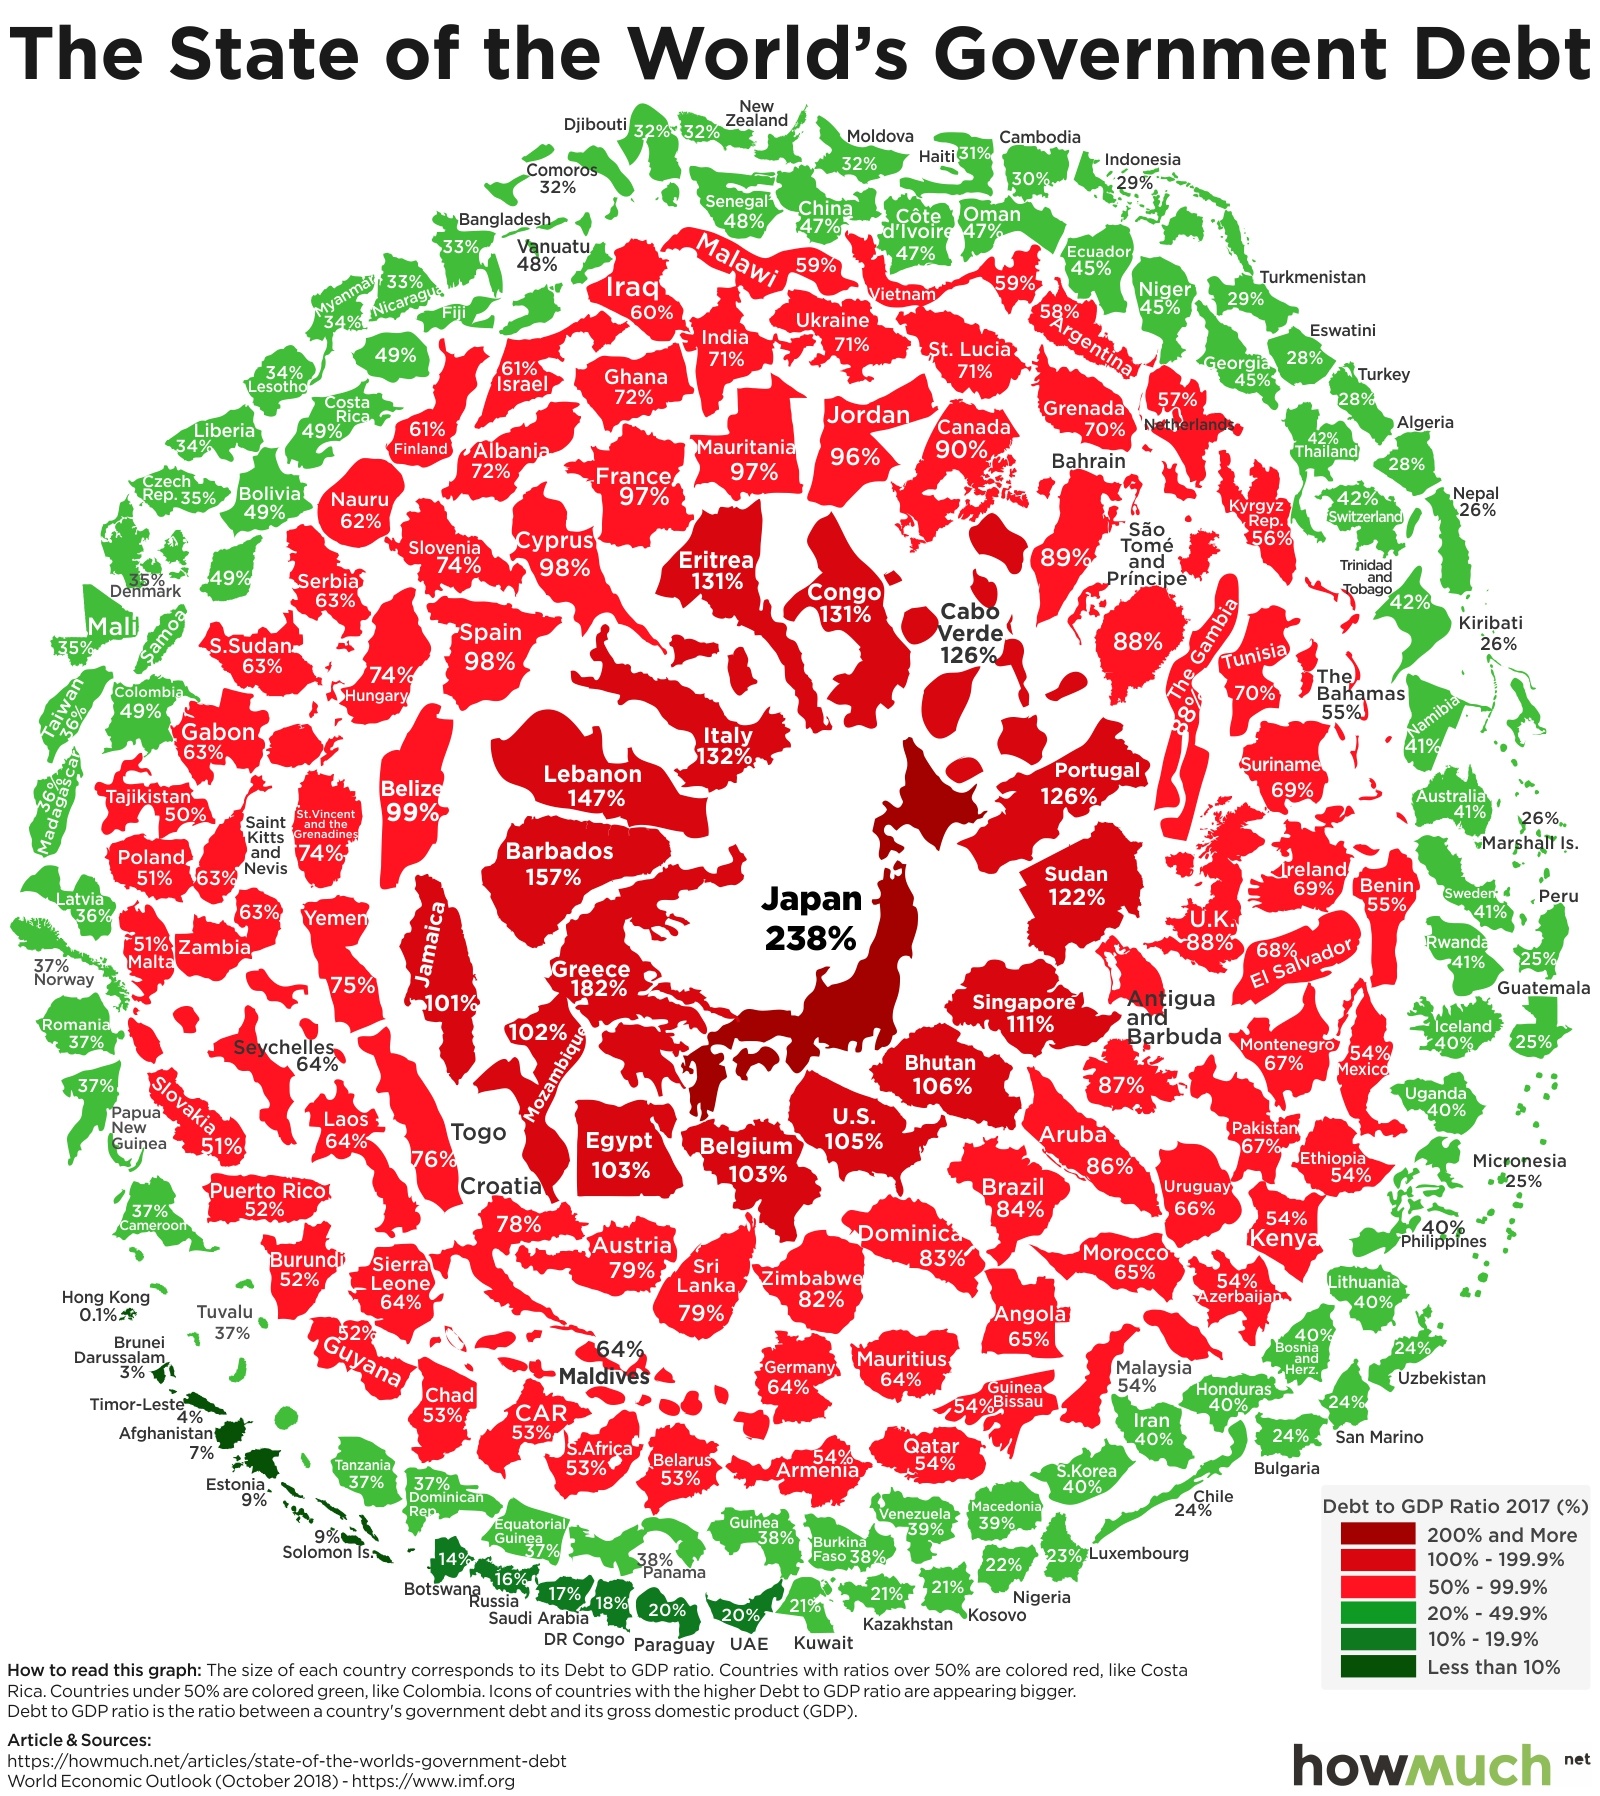
Policymakers have avoided dealing with debt for years, guaranteeing that any resolution will be more painful. This visualization shows which countries have the biggest problems with national debt relative to their economic size.

April 3rd, 2026
Personal Finance
debt
Are young people better or worse off financially than previous generations? Our new visualization creates a snapshot in time of the financial picture for Millennials, Gen Xers and Baby Boomers as each was entering the workforce.