February 13th, 2020
The Economy
Cryptocurrencies
Monetary Policy
Bitcoin is back over $10,000, but how does its liquidity compare to other asset classes? Our visualization puts things in perspective.

January 31st, 2020
The Economy
Social Issues
Monetary Policy
Wealth
Jobs
Five amazing data visuals that we at Howmuch.net wished we created. But since we didn’t, we wanted to share these impressive data visualizations with the HowMuch.net community. Which is your favorite?

January 27th, 2020
The Economy
Investments
Trade
Monetary Policy
How do the U.S. and China compare when it comes to world trading partners from 1980 until the present? Take a look at our helpful visualization to learn more.

January 14th, 2020
Personal Finance
The Economy
Social Issues
Monetary Policy
Electric cars are good for the environment, but they can be bad for your budget. This map breaks down how much it costs and how popular it is to own an electric vehicle.

January 9th, 2020
The Economy
Social Issues
Monetary Policy
Wealth
Jobs
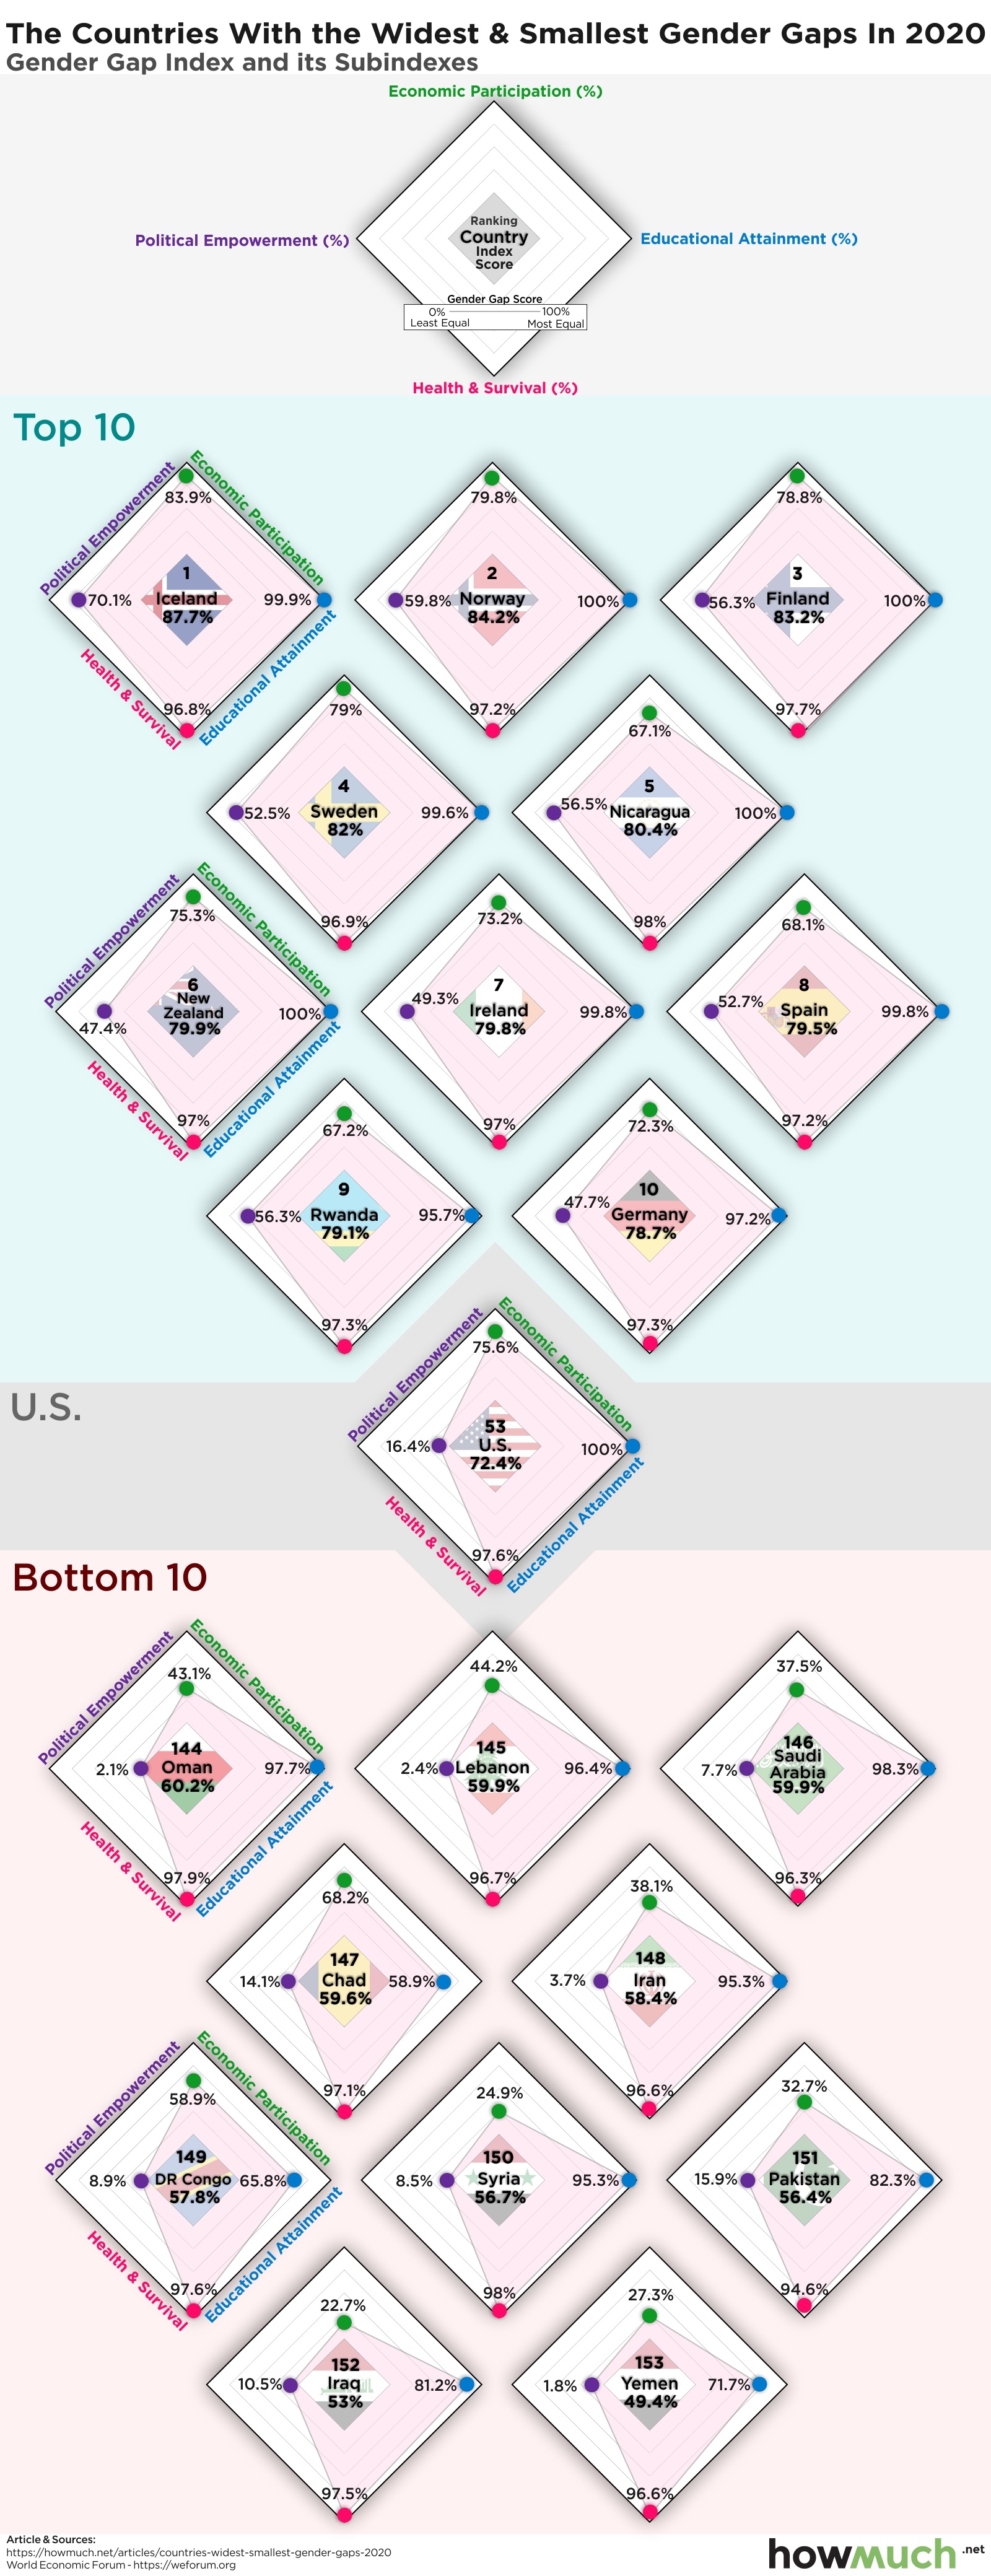
Which countries around the world lead the way in closing the gender gap and are they achieving their goals on all fronts? Our visualization lays out all the key elements for the top scorers.

November 12th, 2019
The Economy
Monetary Policy
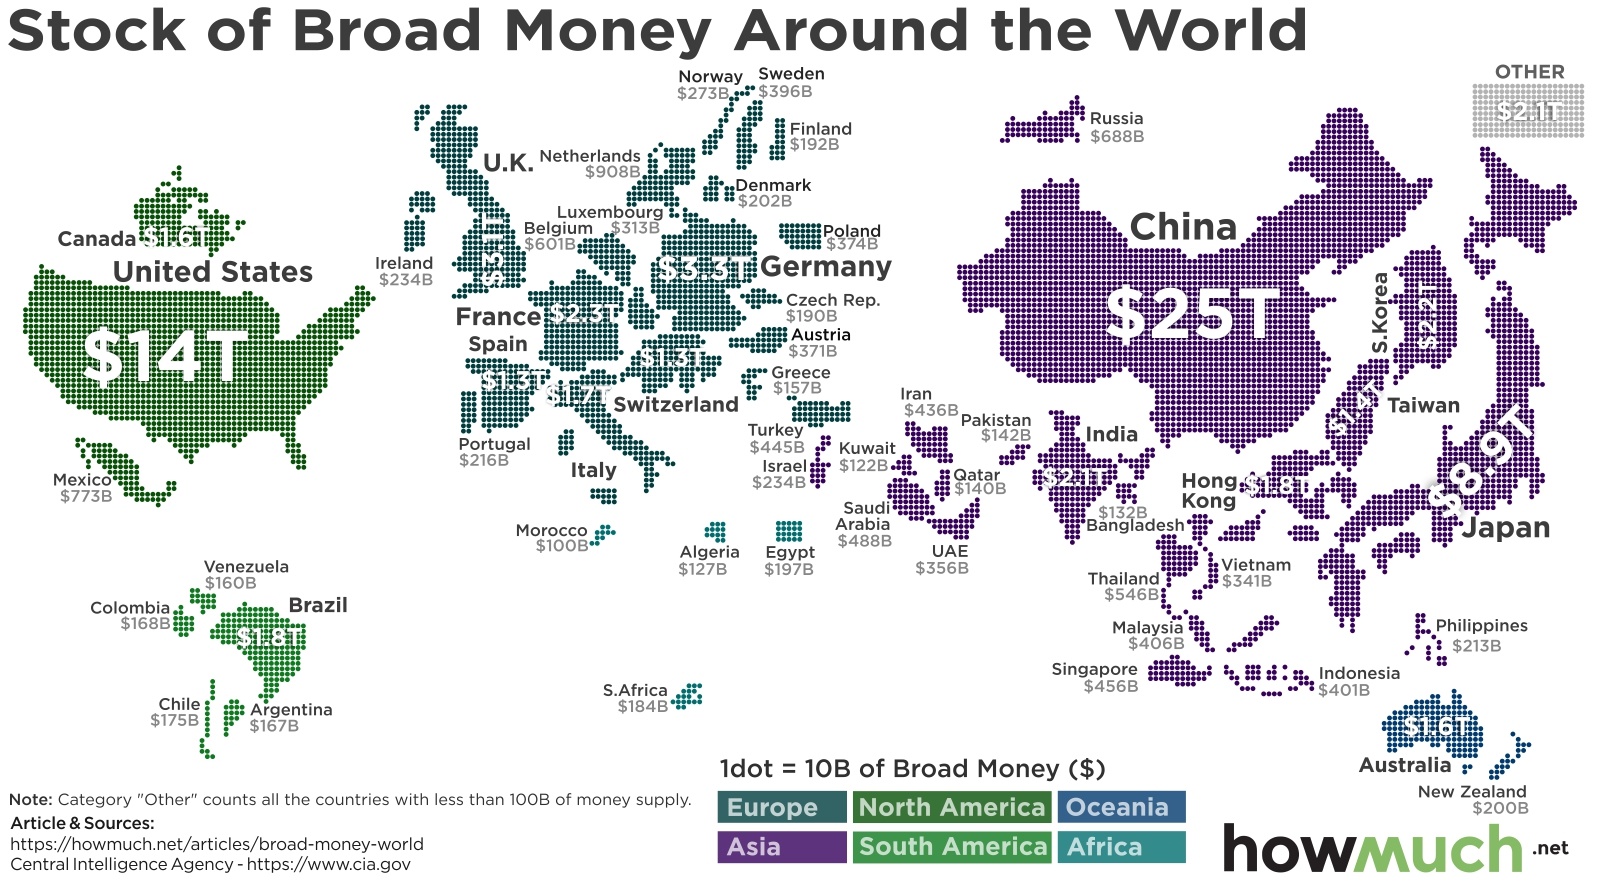
One way to compare wealth between countries is to measure the amount of money currently in circulation

September 3rd, 2019
The Economy
Monetary Policy
You likely are aware that the dollar is less powerful than it was 100 years ago, but just how much has the dollar’s purchasing power decreased? Check out this visualization to find out more.

August 27th, 2019
The Economy
Monetary Policy
Which currencies dominate the global stage? Is the dollar still all that powerful, or are emerging markets catching up? Check out our visualization to see how each currency stacks up

August 15th, 2019
The Economy
Monetary Policy
Which currencies and assets make up most of the total value of currencies in the world? The makeup and how money supply works will give you insight into global economic policy and how it affects you.

May 23rd, 2019
The Economy
Trade
Monetary Policy
China by far holds the world’s most reserves. How will this affect its economic relationship with the U.S. and, ultimately, the unfurling trade war between the two powers?