
April 3rd, 2026
Personal Finance
business
Wealth
These billionaires experienced some major changes in their bank accounts in 2019
April 3rd, 2026
Personal Finance
business
social-issues
Wealth
jobs
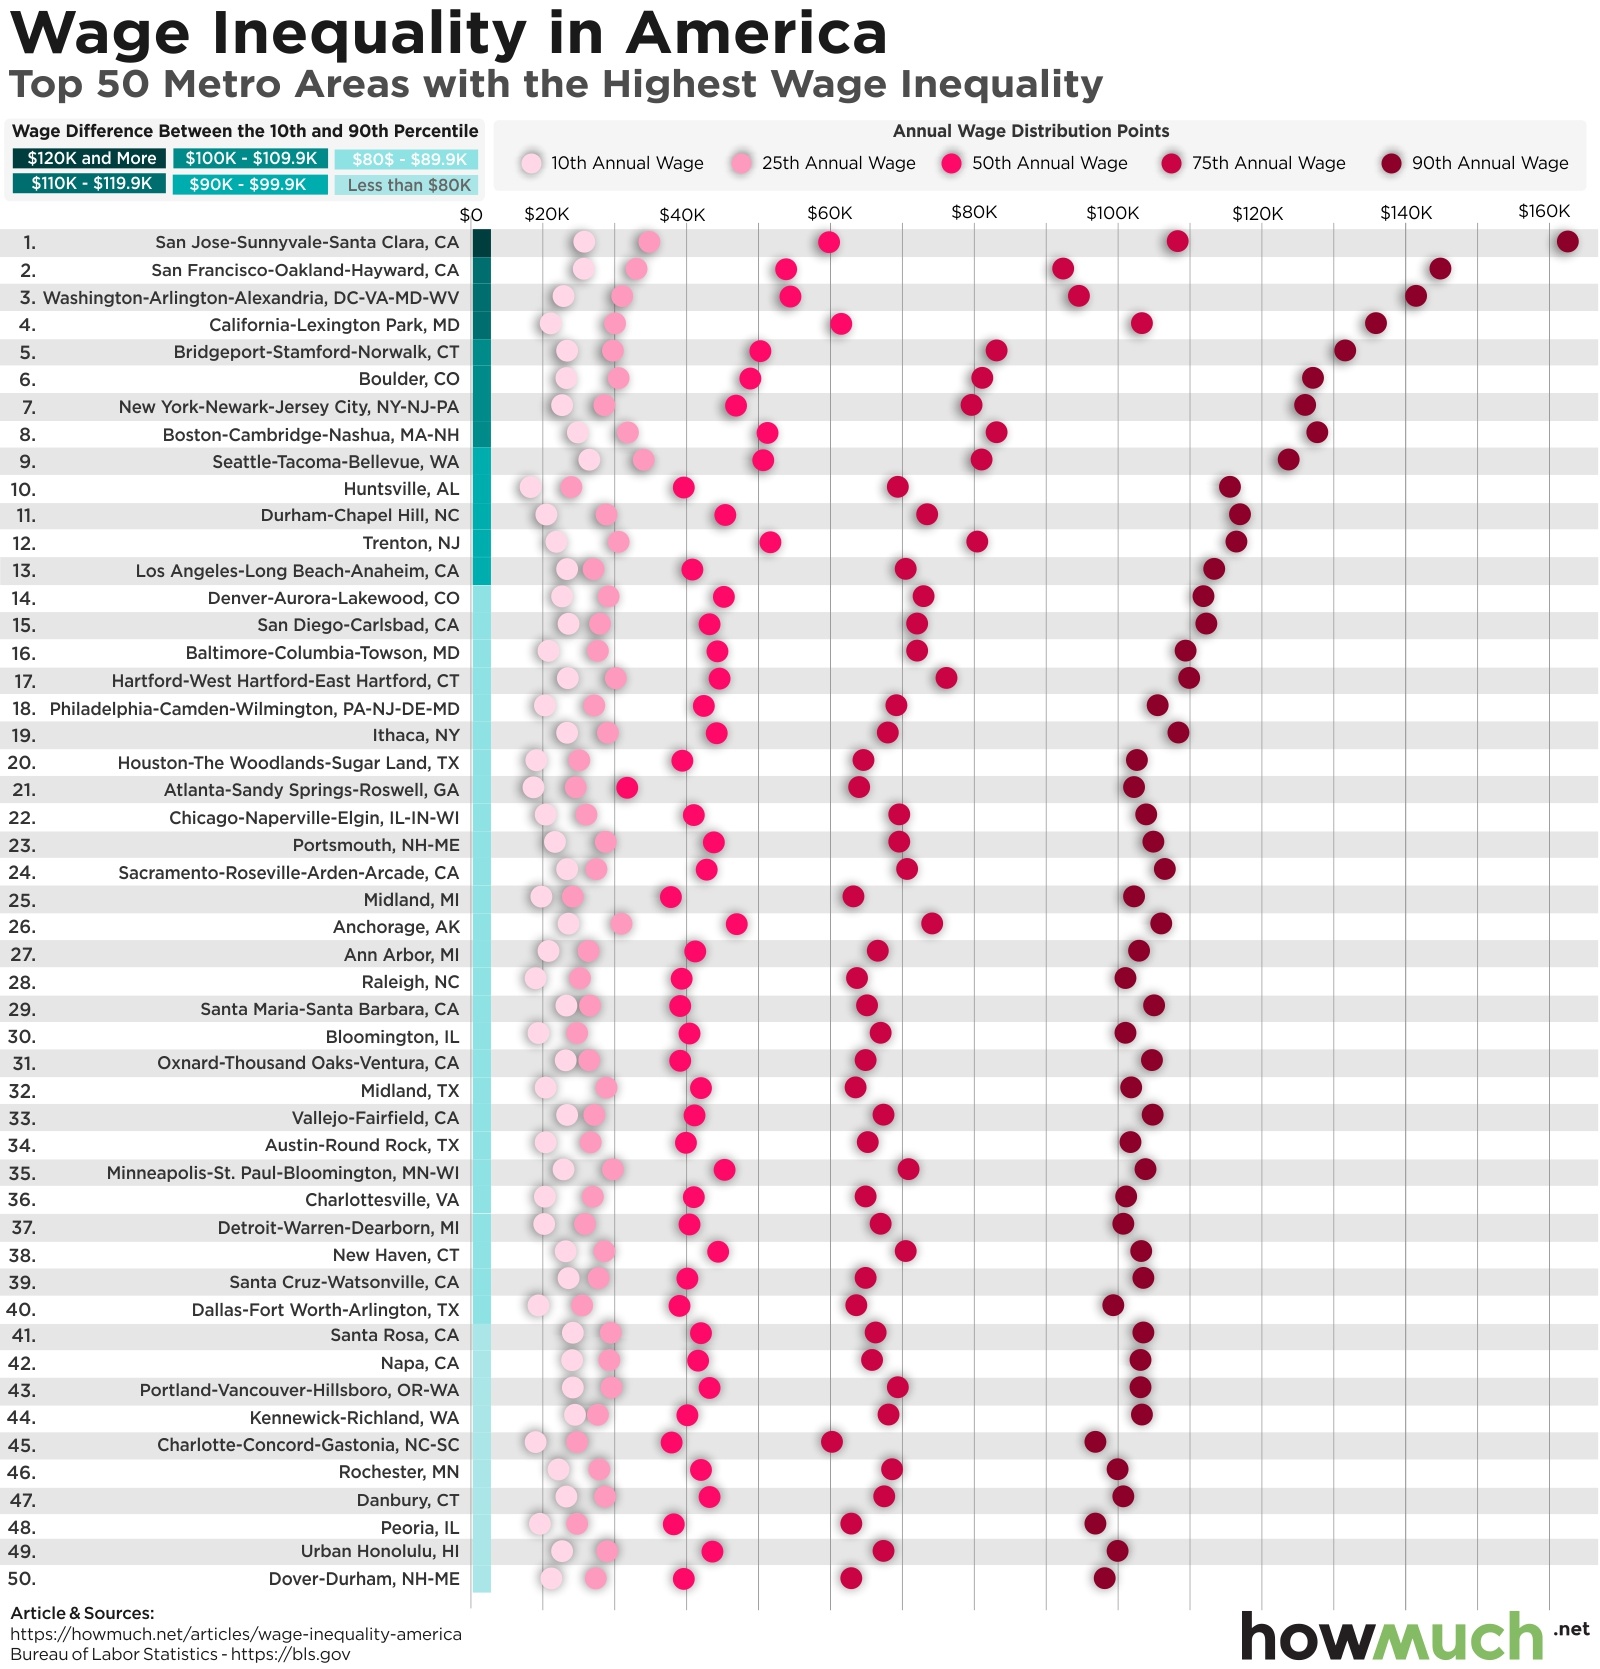
Income inequality is at an all-time high in America. This visualization breaks down the cities with the biggest gaps between high- and low-wage workers.

April 3rd, 2026
Personal Finance
business
The Economy
social-issues
Wealth
What areas would you expect to drive U.S. economic output? Do more people equal more firepower, or does the location matter? Check out our county-level visualization to find out.

April 3rd, 2026
Personal Finance
business
The Economy
taxes
debt
jobs
We covered lots of different topics in 2019, from the cost of a comfortable retirement to the looming government debt bubble and the world’s gold reserves. Here’s what we deemed the 10 best visualizations for the year

April 3rd, 2026
Personal Finance
If you are moving to a new state, your auto insurance rates might go up. Our visual shows how minimum insurance requirements differ across the country

April 3rd, 2026
Personal Finance
taxes
States tax lots of different things, like income, property, sales and sins like tobacco and alcohol. Our visualization breaks down the most and least friendly states for total taxation in the country.

April 3rd, 2026
Personal Finance
social-issues
Some U.S. metro areas have a worse track record for income inequality than others

April 3rd, 2026
Personal Finance
This map illustrates how hard it is for average workers to enjoy a comfortable standard of living.

April 3rd, 2026
Personal Finance
‘Tis the season for holiday spending. How does your favorite holiday of the year compare to the rest?

April 3rd, 2026
Personal Finance
social-issues
Now you need more than $500,000 per year to be in the top 1% of U.S. earners.