April 15th, 2019
Personal Finance
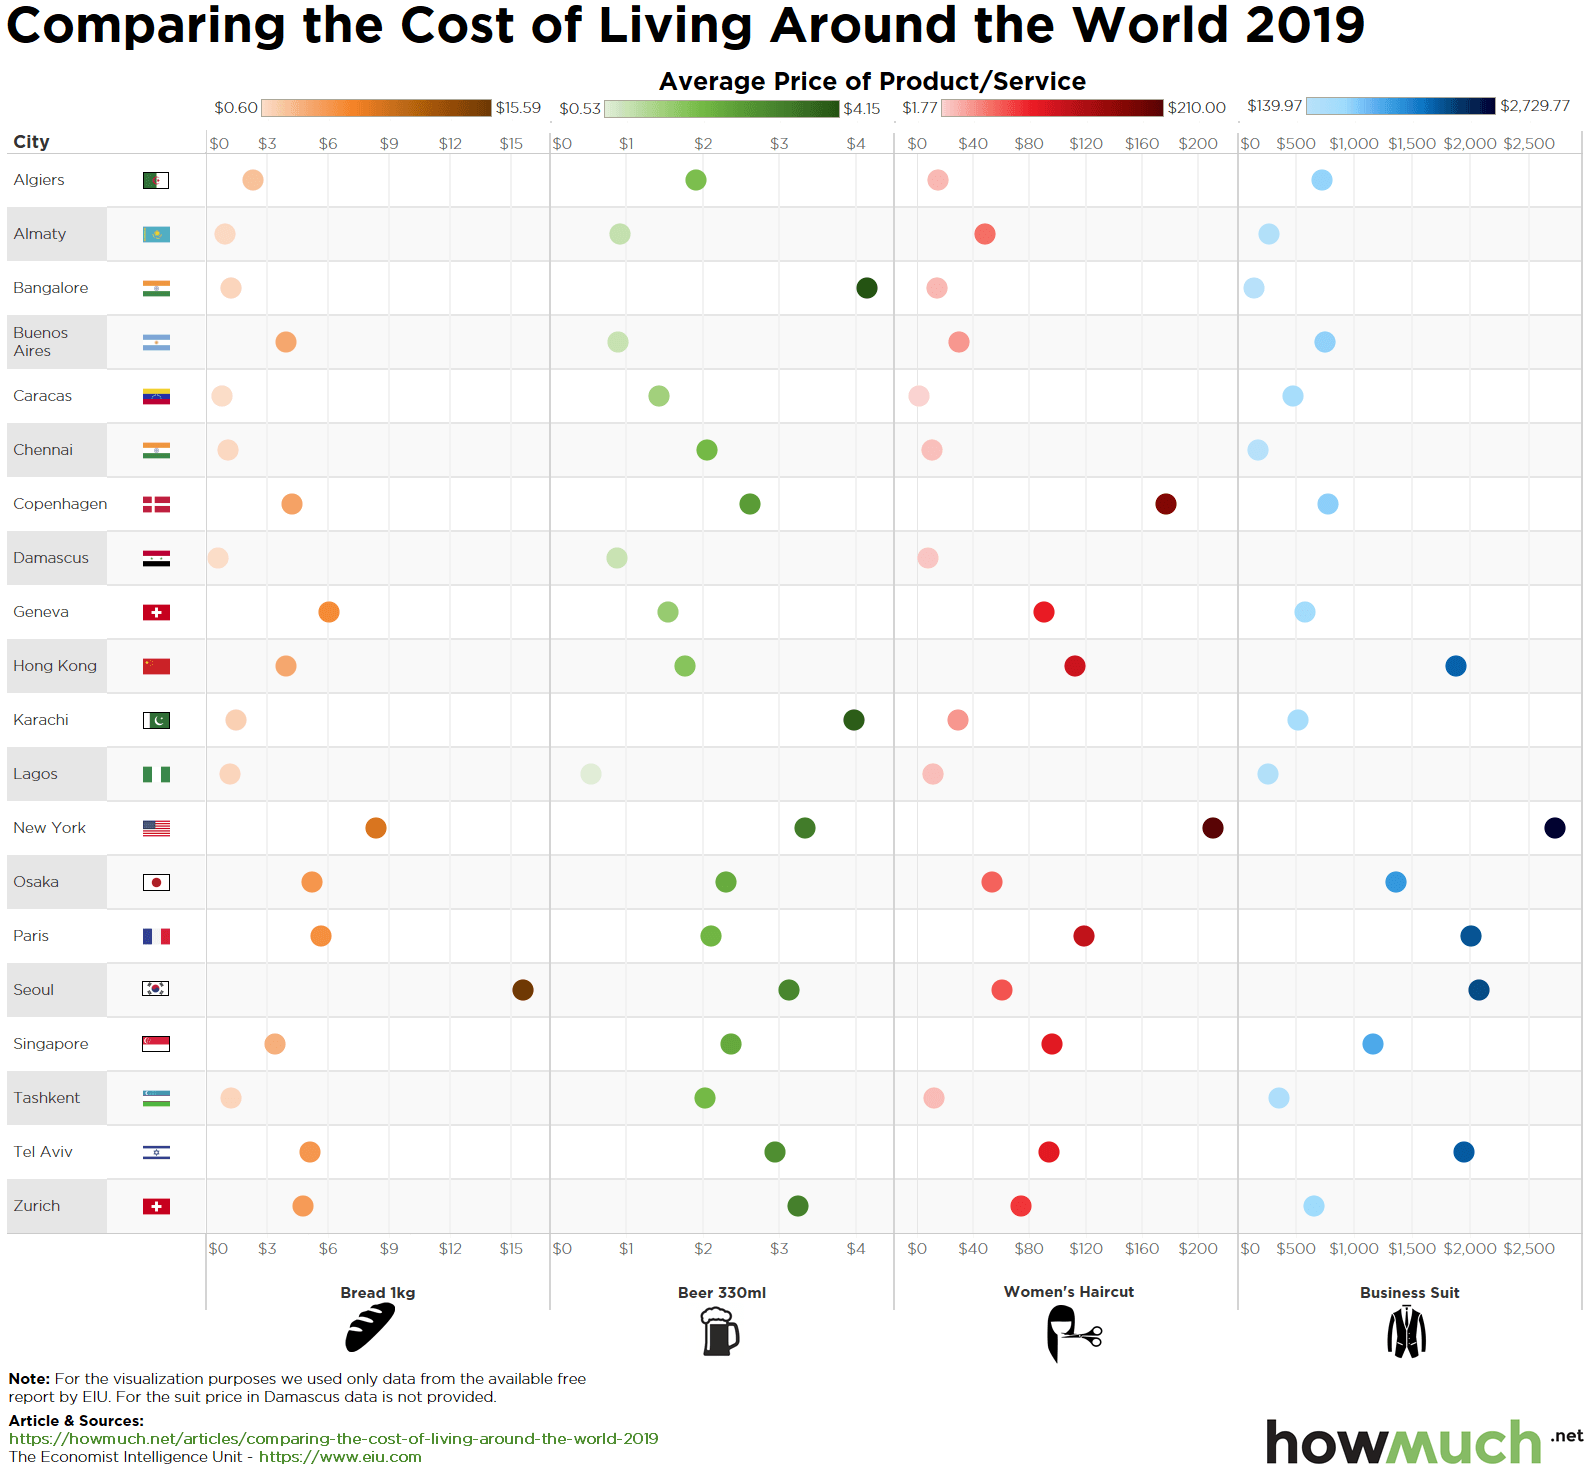
How much will you have to budget for a haircut, a new suit, or a loaf of bread? That all depends on where you live

April 9th, 2019
Personal Finance
Social Issues
Have you ever noticed how prices for some goods differ based on whether they are marketed for men or women? If so, you have encountered an economic phenomenon known as the “pink tax”

April 3rd, 2019
Personal Finance
Beer is a popular beverage all around the world. But how much will a pint set you back in different cities?

April 1st, 2019
Personal Finance
Social Issues
How much money do you need to make to be considered at risk of poverty? In some countries, the threshold is higher than you might think

March 28th, 2019
Personal Finance
Taxes
Wealth
As the April 15 deadline rapidly approaches, taxes are on national mind. Even though everyone’s tax situation is unique, there are a number of taxation trends at the state level which suggest that not everyone is paying their fair share

March 18th, 2019
Personal Finance
Jobs
This graphic shows the mean yearly income of financial advisors in all 50 states. Their average salaries range between just over $76K in Vermont to more than $166K in New York

March 15th, 2019
Personal Finance
Where you live (and drive) has a huge impact on how much you pay for auto insurance. Our newest visualization breaks down average annual car insurance premiums by state and how some parts of the country are much more expensive for drivers than others

March 4th, 2019
Personal Finance
Debt
Unsecured personal loans are on the rise in the U.S., but do you know how people are using the money? Our visualization lets you see the most common reasons people take on this type of debt

February 18th, 2019
Personal Finance
Social Issues
The simple truth behind the gender pay gap is it gets worse as workers get older. Our visualization shows how men earn more than women at every age, but just as workers settle into a career, the gap explodes

February 13th, 2019
Personal Finance
Taxes
The federal government is open (for now), tax season is here and refunds are starting to go out. Our map shows you the size of the average federal refund for taxpayers in every state across the country