
April 3rd, 2026
The Economy
On the edge of a potential recession, we gauge the economic well-being of all states.

April 3rd, 2026
The Economy
trade
As the trade war drags on, here’s a look at which states stand to lose the most from tariffs.
April 3rd, 2026
The Economy
trade
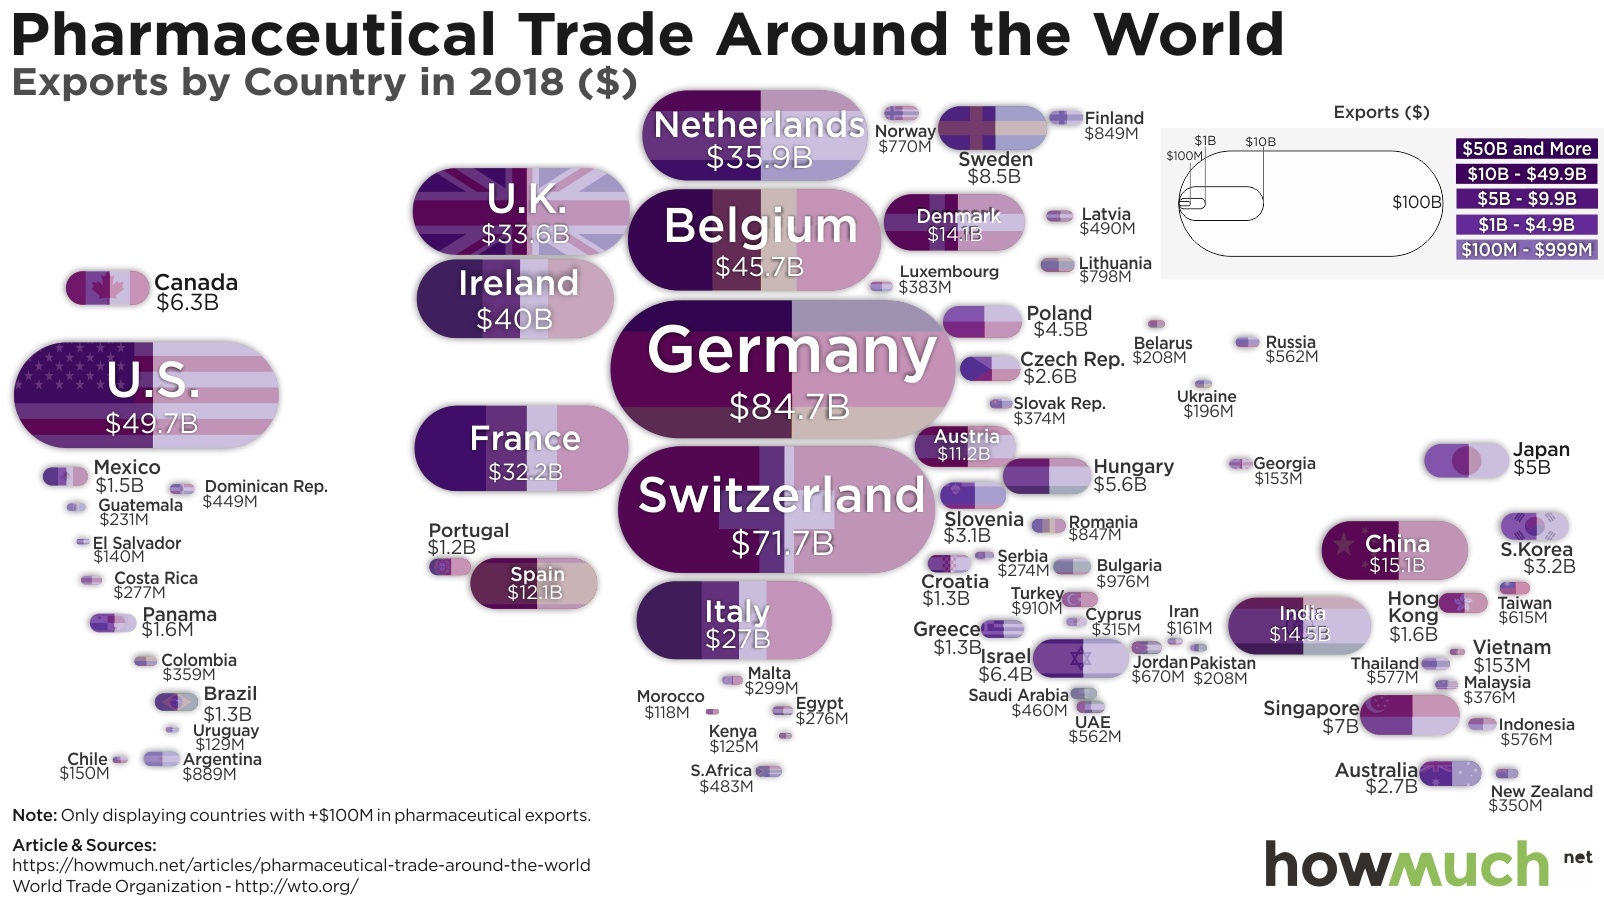
Pharmaceuticals have a major impact on the global economy. But who are the biggest suppliers and consumers? We created a visualization to show how much countries around the world import and export pharmaceuticals in terms of dollars.

April 3rd, 2026
The Economy
monetary-policy
You likely are aware that the dollar is less powerful than it was 100 years ago, but just how much has the dollar’s purchasing power decreased? Check out this visualization to find out more.

April 3rd, 2026
The Economy
trade
Financial service exports grew by over 5% in 2018, but an inverted yield curve and uncertain Brexit deal bring the market’s future into question

April 3rd, 2026
The Economy
monetary-policy
Which currencies dominate the global stage? Is the dollar still all that powerful, or are emerging markets catching up? Check out our visualization to see how each currency stacks up

April 3rd, 2026
Real Estate
debt
Mortgage rates are falling, but unpaid mortgage debt is the highest it’s ever been. Here’s a look at how total mortgage debt in the U.S. has changed over time.

April 3rd, 2026
The Economy
trade
Ever wondered how much countries spend on imports? Check out this visualization to understand the impact of international trade on the global economy.

April 3rd, 2026
The Economy
trade
How much are the top countries exporting each year? Check out our world map with exports listed by each country.

April 3rd, 2026
business
Global business is booming, and the world’s largest companies are seeing record levels of revenue. Here’s a look at which global companies rise to the top.