
April 3rd, 2026
The Economy
trade
Despite what you may know about global trade, these graphics will give you a unique insight into the global economy

April 3rd, 2026
The Economy
trade
Agriculture accounts for only 3% of the world's GDP, but employs 30% of the world’s workers. Here’s a closer look at agricultural weight in the global economy

April 3rd, 2026
Personal Finance
debt
Auto loan debt balances in the U.S. reach all-time highs, sparking more uncertainty about the future of the industry

April 3rd, 2026
business
debt
A look at the biggest corporate debt holders in America shows how debt is used differently across industries

April 3rd, 2026
The Economy
debt
Both national debt and household debt are on the rise in the U.S. What does this mean for the economy?

April 3rd, 2026
Wealth
The U.S is home to more millionaires and billionaires than any other country in the world. Here are the highest net-worth individuals in each state

April 3rd, 2026
The Economy
social-issues
The cost of U.S. immigration enforcement and border security continue to rise steeply. We look at the trends since the early 1990s

April 3rd, 2026
Personal Finance
debt
U.S. national and consumer debt is reaching unprecedented heights. Take a look at how each state is being impacted by the current United States debt crisis.

April 3rd, 2026
business
Certain major tech and financial companies have grown so much, their market capitalization is worth more than the GDP of some countries or regions.
April 3rd, 2026
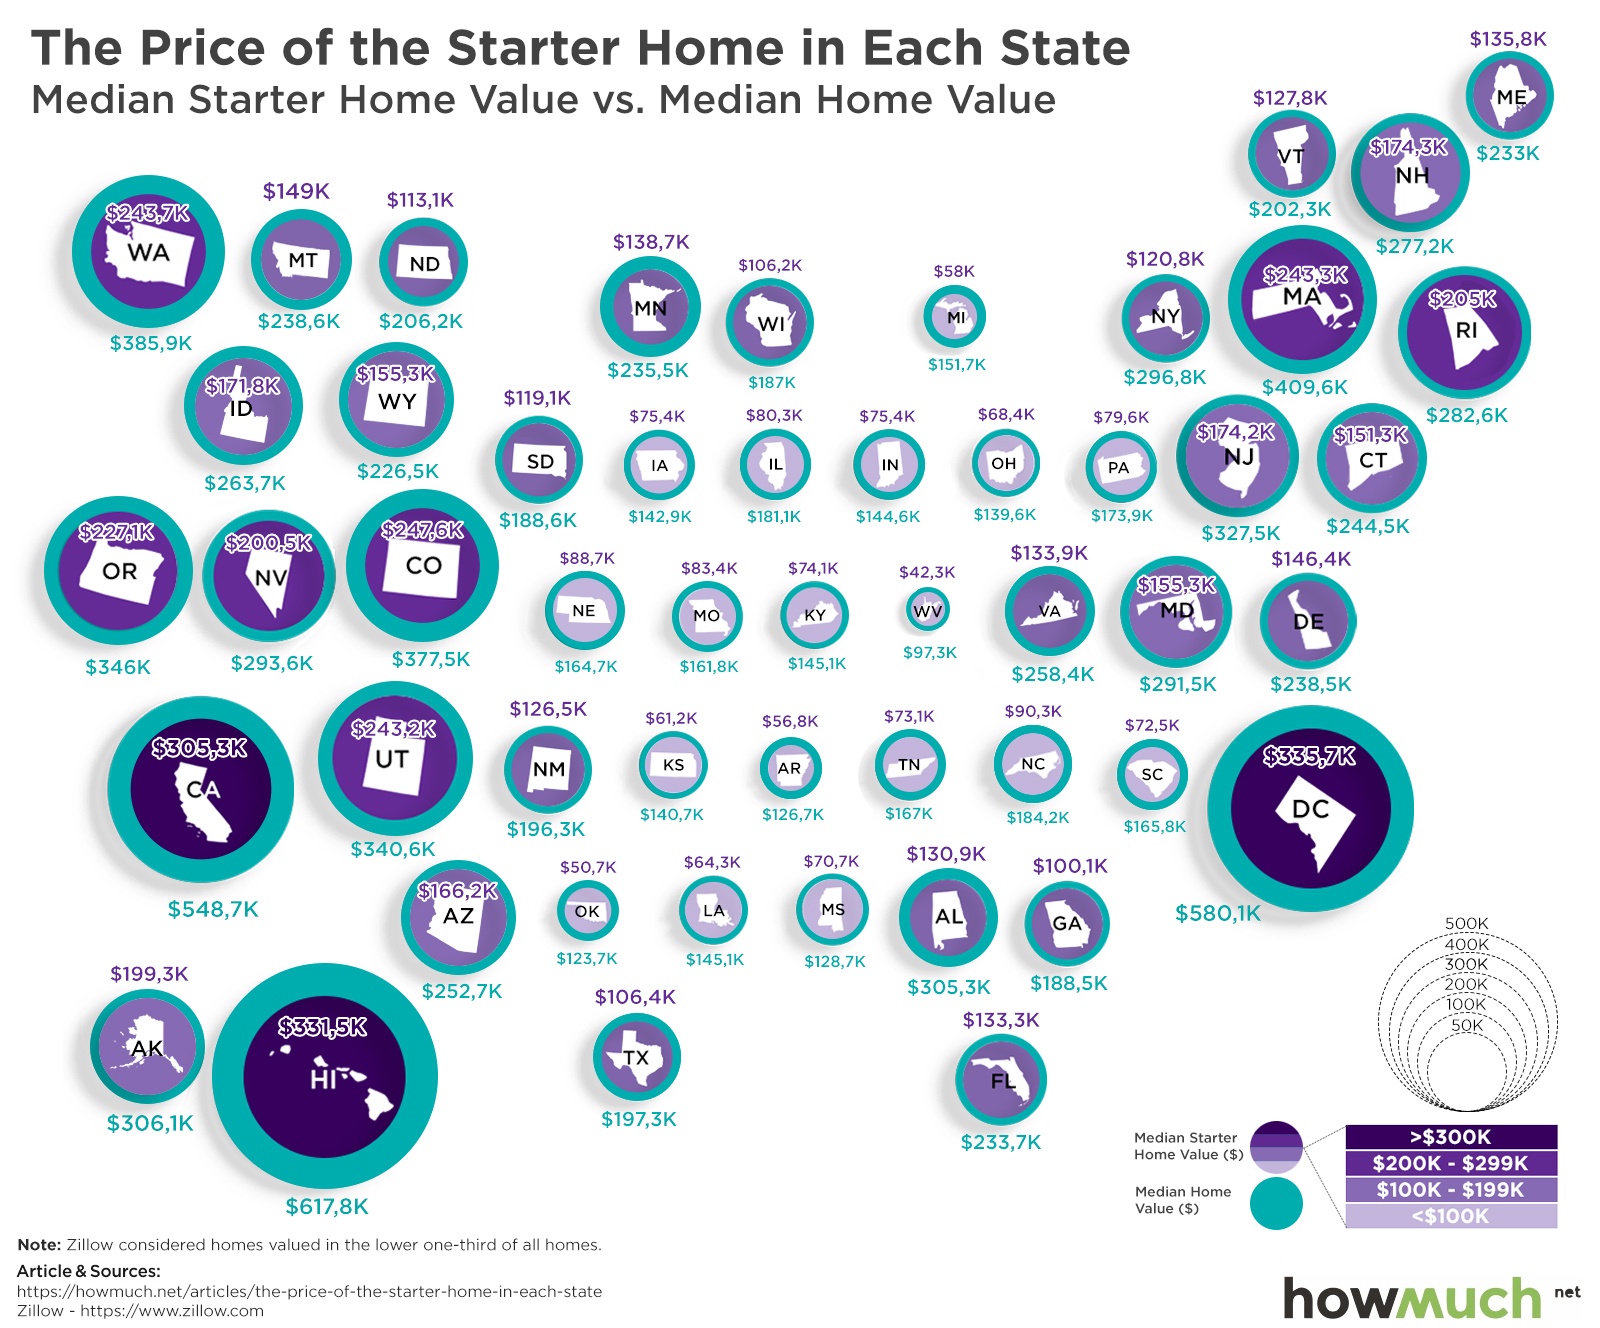
Personal Finance
Real Estate
Looking to buy your first house? The real estate market for starter homes is more budget-friendly in some states than in others