September 5th, 2018
Wealth
The country’s top female entrepreneurs are building empires worth billions, but can you name all the women at the top of the business world? Our new visualization compares the fortunes of the 60 wealthiest self-made women in America.

September 4th, 2018
Jobs
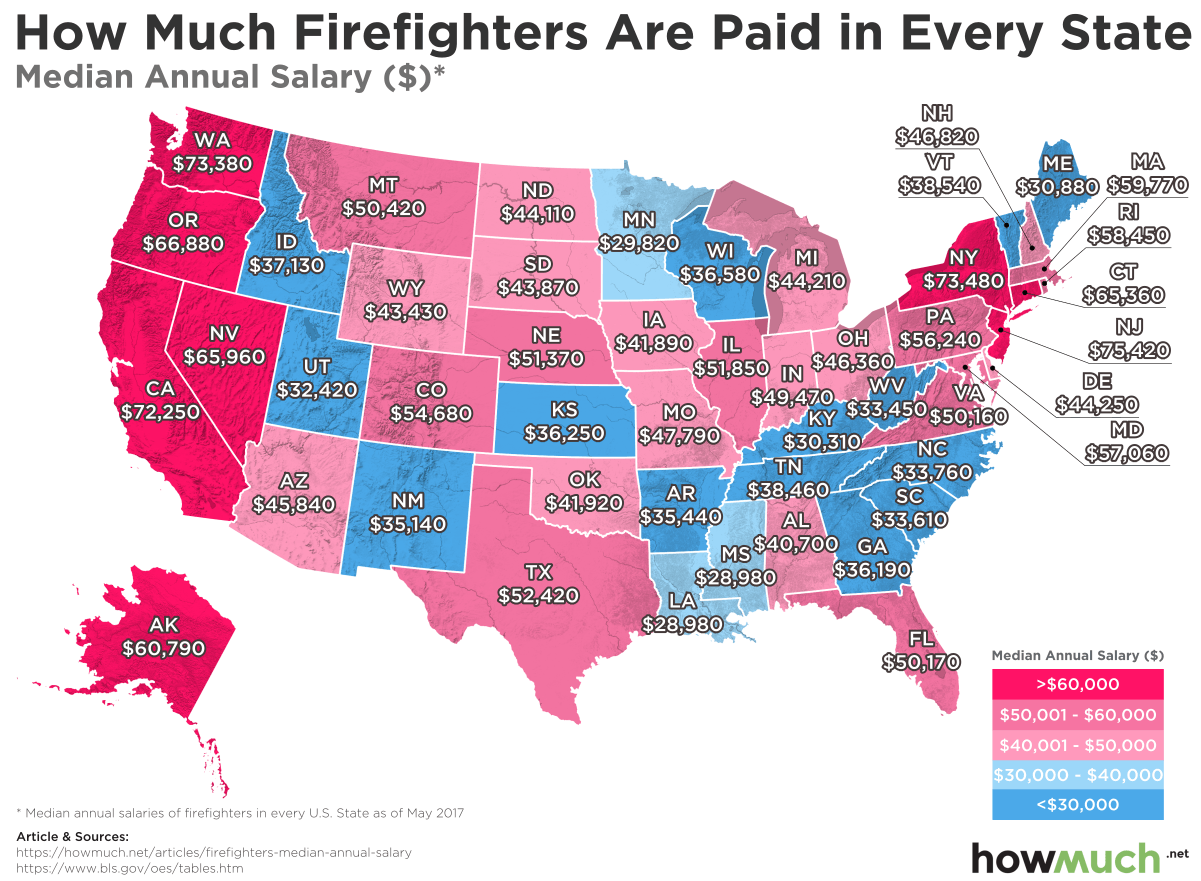
Firefighters risk their lives for the public, but how much money should they make? Our latest map breaks down median firefighter salaries on a state-by-state basis, highlighting the places where they barely earn above the poverty line.

September 3rd, 2018
Self Made Women

August 31st, 2018
Social Issues
Jobs
You know CEOs make a lot more money than average workers, but 300 times more?

August 30th, 2018
Personal Finance
The richest 1% are insanely rich, but did you know that there’s inequality even among the wealthiest people? This visualization reveals how much income is needed to crack the top 1% and the average income in that elite group

August 28th, 2018
Business
Trade
Most people drink coffee every single day, but do you know where that morning buzz ultimately comes from? Our new map breaks down the entire global market of coffee exports in one easy-to-understand visualization.

August 27th, 2018
Personal Finance
Social Issues
Should people get paid more just because they have more experience? Our new map breaks down median income levels among different generations for each state, and Millennials are far behind their older colleagues.

August 23rd, 2018
Personal Finance
The monthly income that a family needs to be able to afford a typical rental home differs dramatically across the country. Our newest map breaks down the most (and least) expensive places to live

August 21st, 2018
Wealth
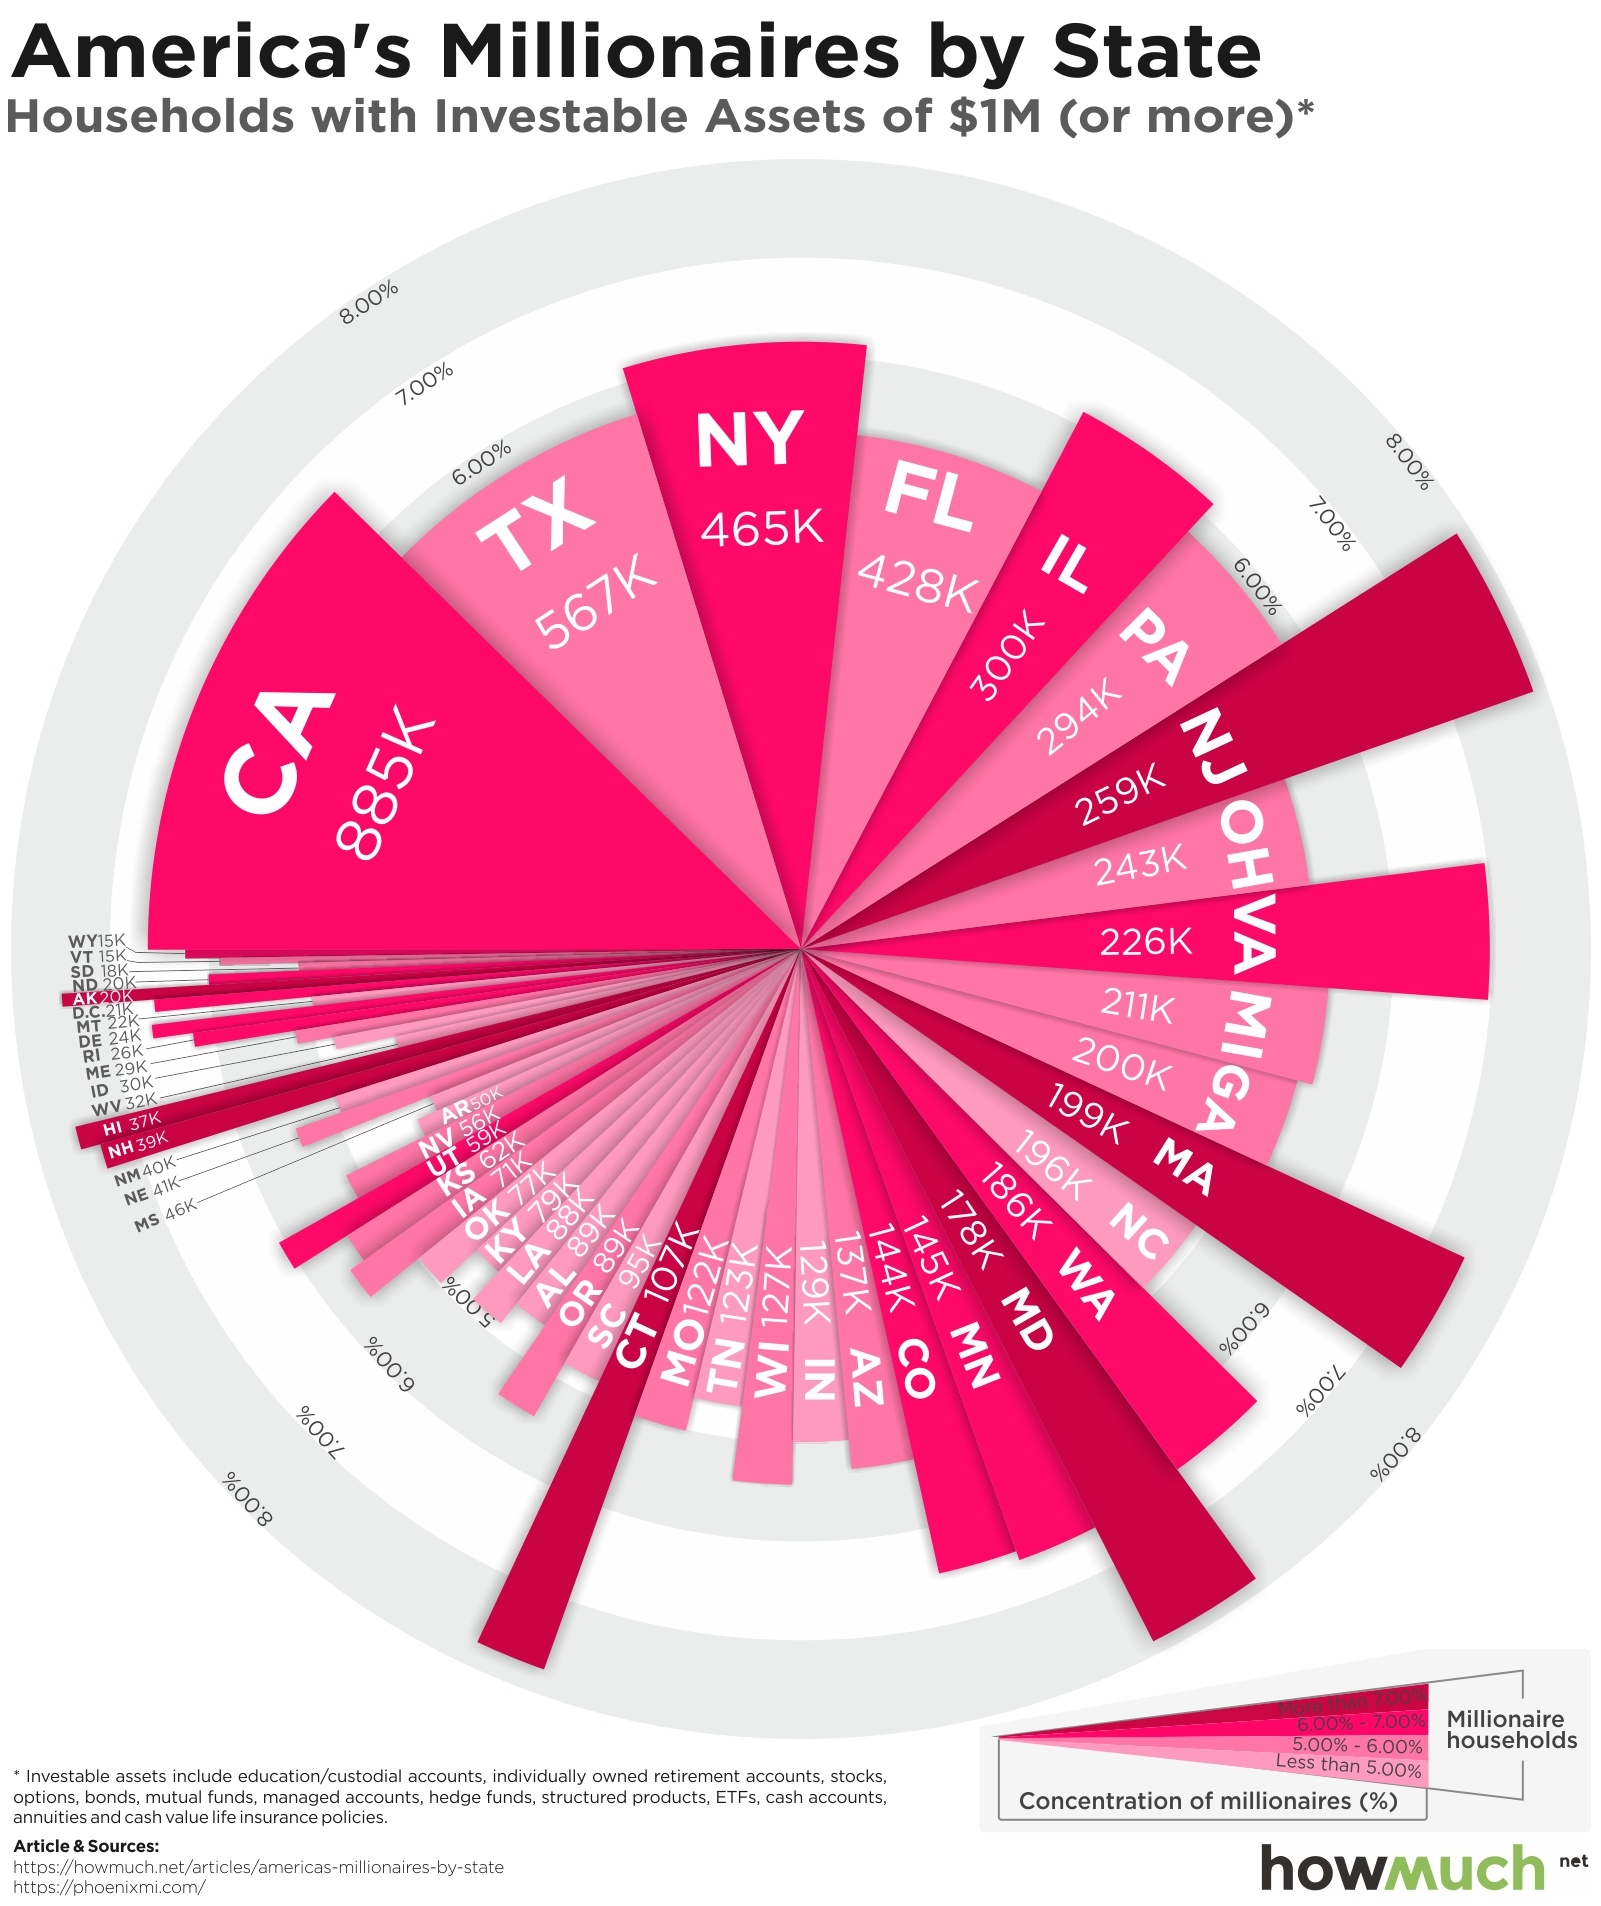
Most people think that to make it rich, you have to move to a big city on one of the coasts. Our newest visualization reveals a different story—there are lots of millionaires living all over the country.

August 17th, 2018
The Economy
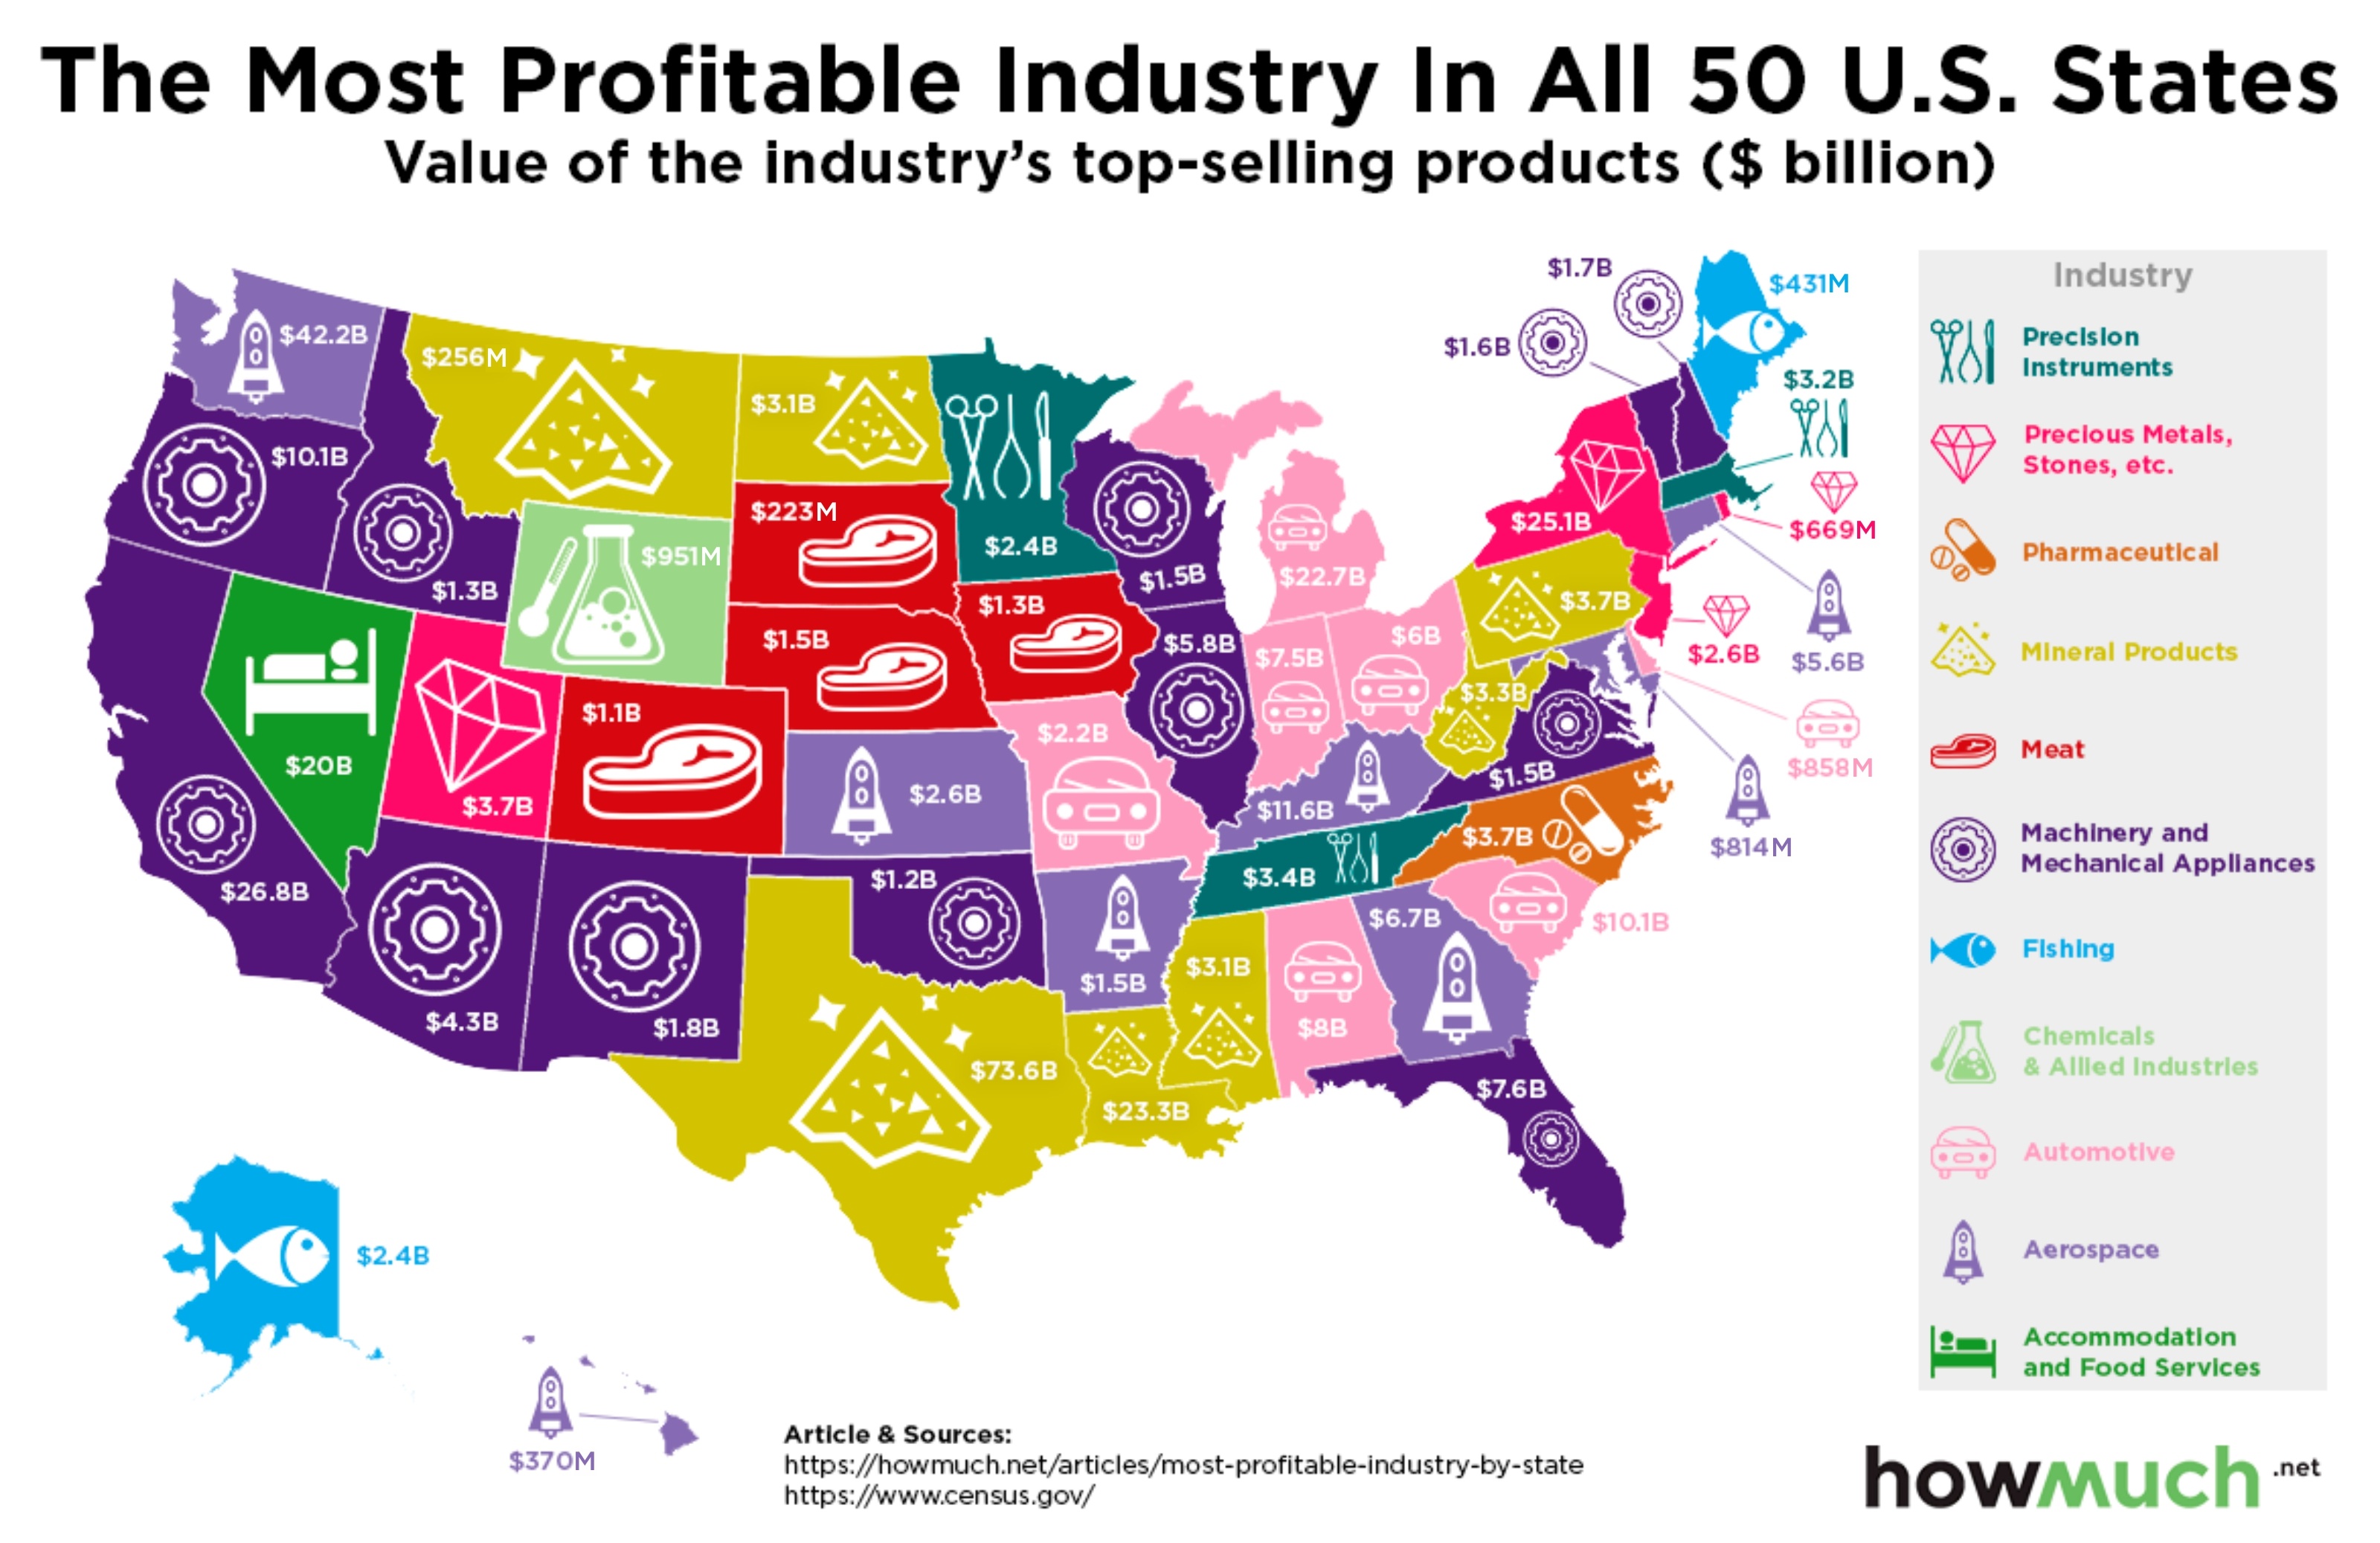
Texas has oil drillers, Alaska has fishermen, and Kansas has… astronauts? Our newest map breaks down the most profitable industries for every state across the country. The results might surprise you.