April 3rd, 2026
business
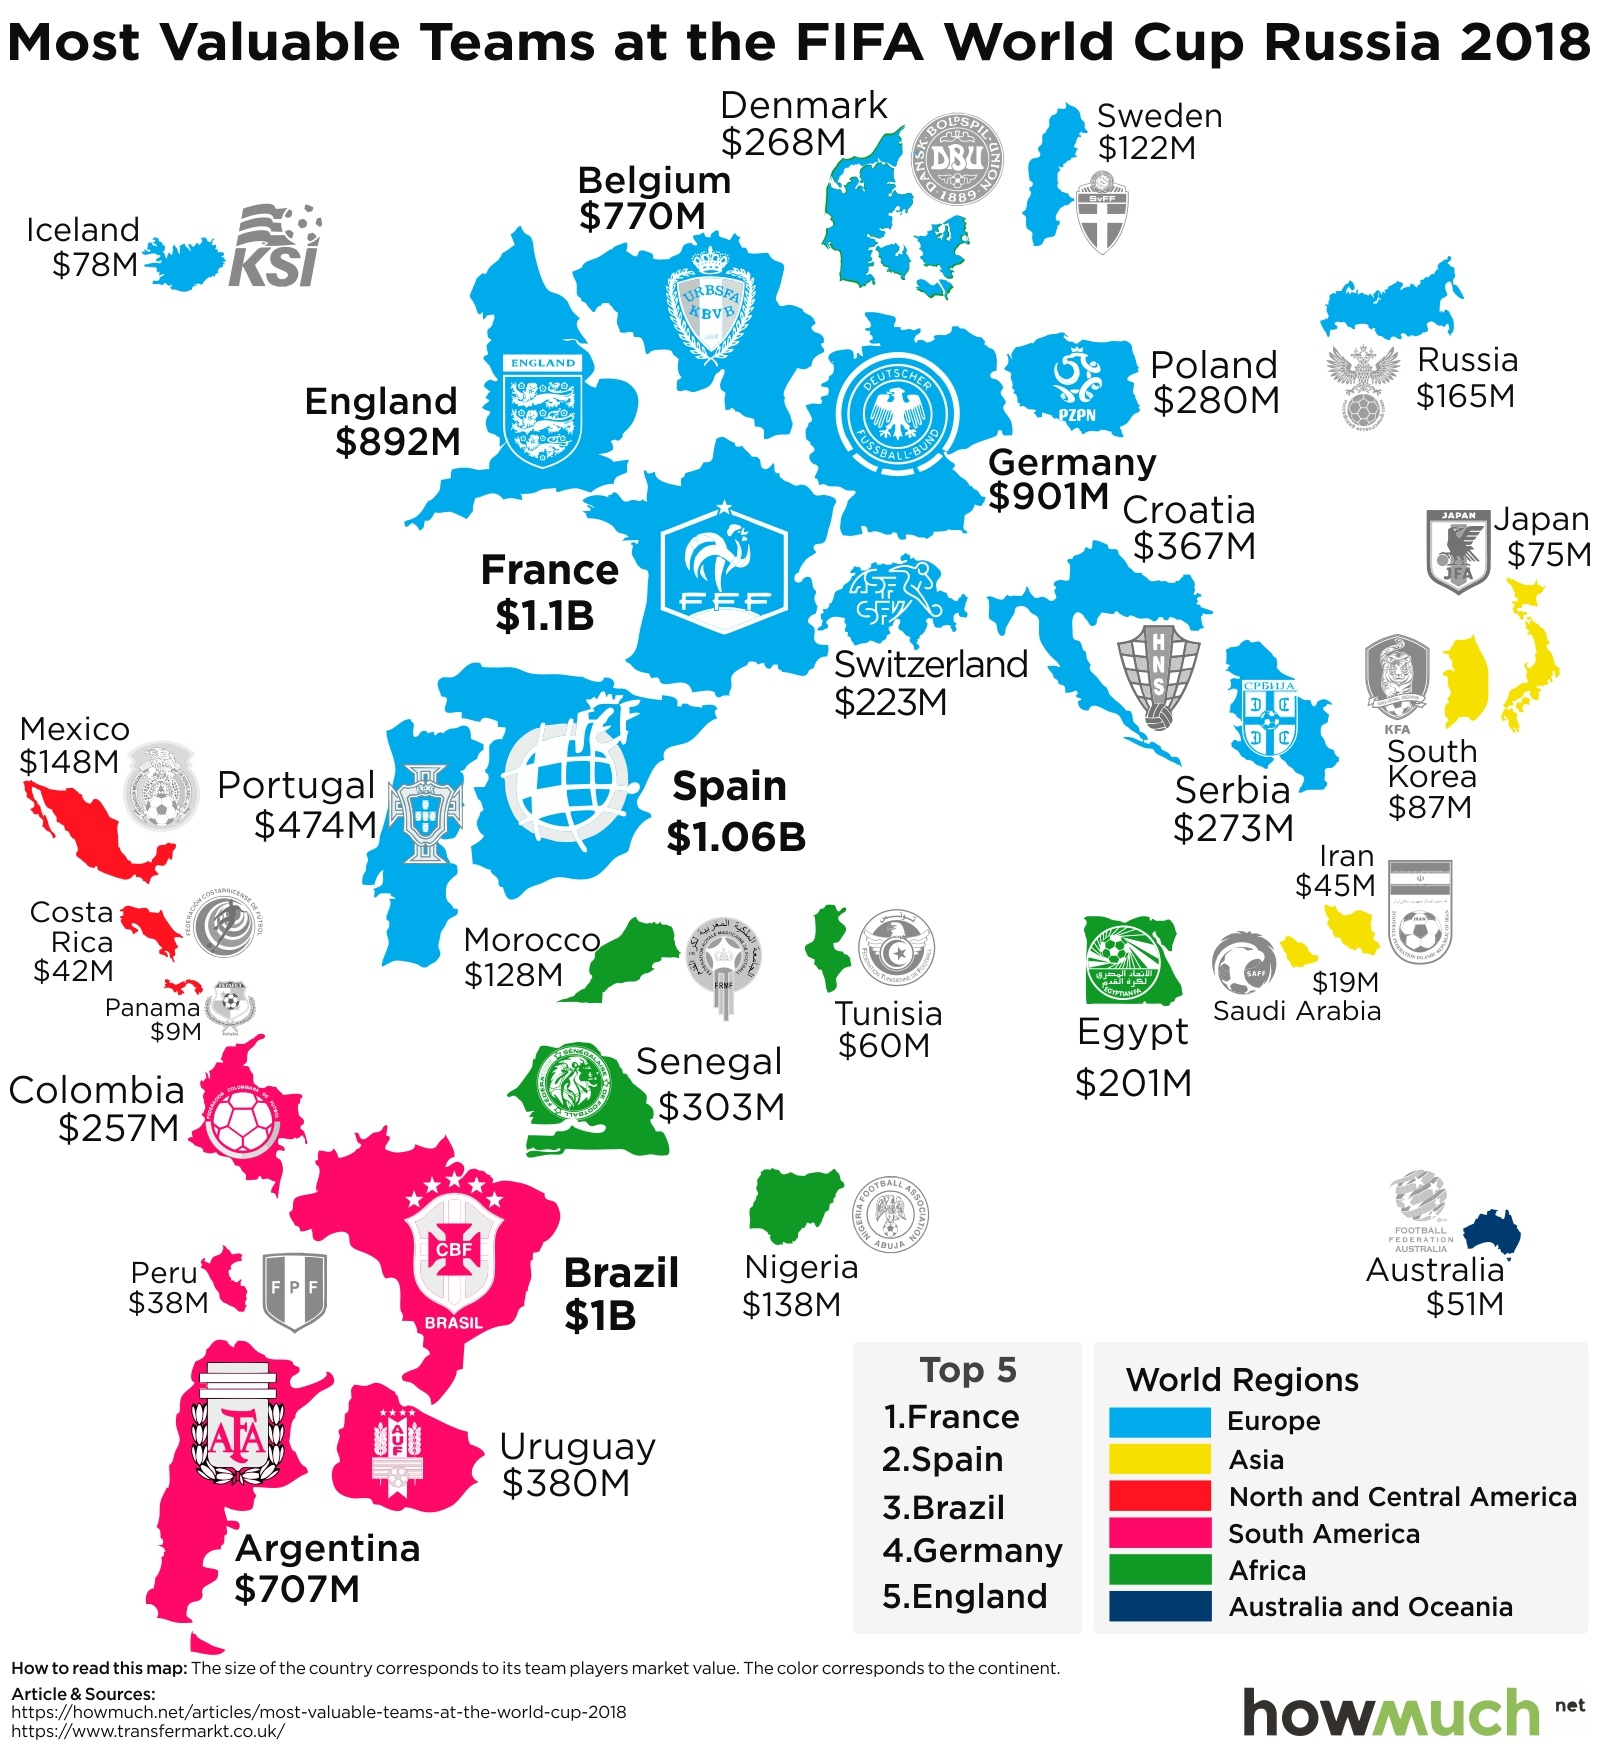
The World Cup is full of all-star talent, so how much is each team worth? Our new map demonstrates how the rosters of some countries have a value of well over $1 billion, while others are worth pennies on the dollar.

April 3rd, 2026
business
The World Cup is finally back, but did you know that teams are playing for more than just pride? Our new visualization shows how each of the 32 teams is guaranteed a multi-million-dollar payout from FIFA.

April 3rd, 2026
business
Companies can be fiercely protective of their brands, and for good reason. Our new visualization demonstrates how much money is at stake by breaking down the companies and industries with the best brand values in the U.S.

April 3rd, 2026
business
jobs
Publicly traded companies are now required to disclose how much their CEOs make in comparison to the average worker. Our new visualization breaks down the 20 biggest pay disparities in corporate America.

April 3rd, 2026
Personal Finance
Going to college is an investment in the future, but do you know which schools have the best ROI? Our new map breaks down average tuition, debt and ROI for the top value colleges in every state.

April 3rd, 2026
business
Do you know which companies post the highest revenue figures in the country, year after year? Our new visualization breaks down the ever-changing revenue numbers for the largest corporate giants since 2008.

April 3rd, 2026
The Economy
social-issues
Hurricanes, heatwaves, and floods are inherently unpredictable, but do you know which ones caused the most damage? Our new visualization compares the cost of every natural disaster since 1980.
April 3rd, 2026
jobs
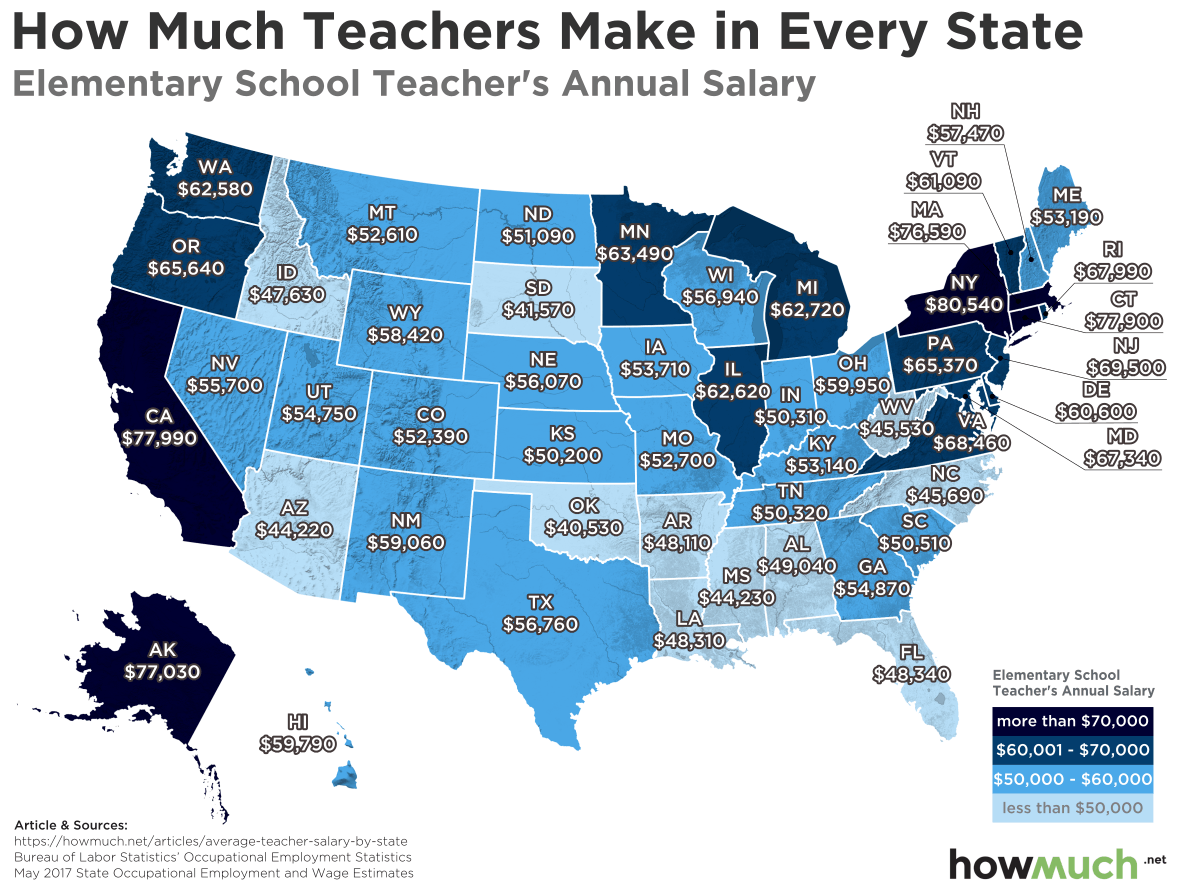
Teachers are going on strike for higher salaries in several places around the country. Our new maps highlight the dramatic wage differences for elementary, middle and high school teachers in every state.

April 3rd, 2026
Personal Finance
taxes
There are lots of countries where workers earn less than average but keep more of their money. Our new visualization reveals how taxes affect take home pay for workers across the developed world.
April 3rd, 2026
The Economy
monetary-policy
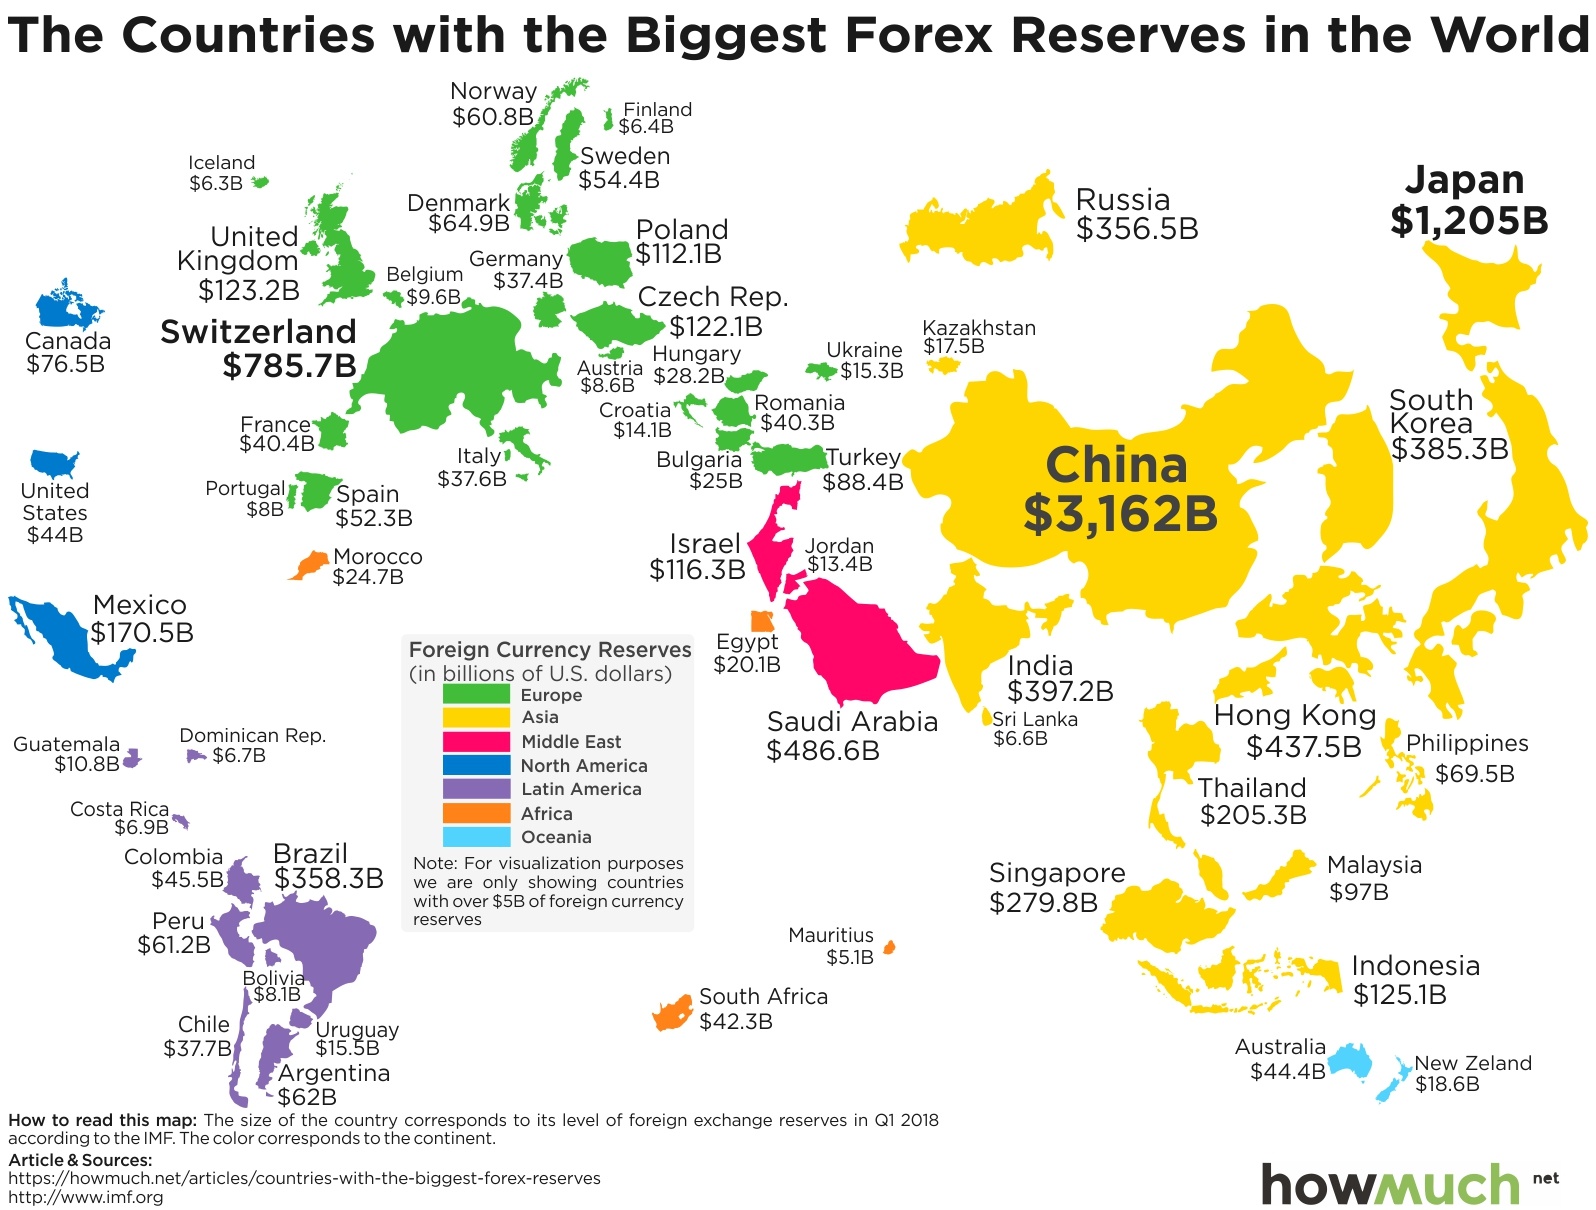
Want to see a leading indicator for how prepared a country is for an economic downturn? Check out our new map of foreign exchange reserves for every country in the world.