
April 3rd, 2026
The Economy
There’s been a lot of news lately about the minimum wage in the U.S. How much has it really changed over the years?

April 3rd, 2026
The Economy
This worker productivity chart challenges the traditional wisdom that equates longer hours with more productivity.
April 3rd, 2026
The Economy
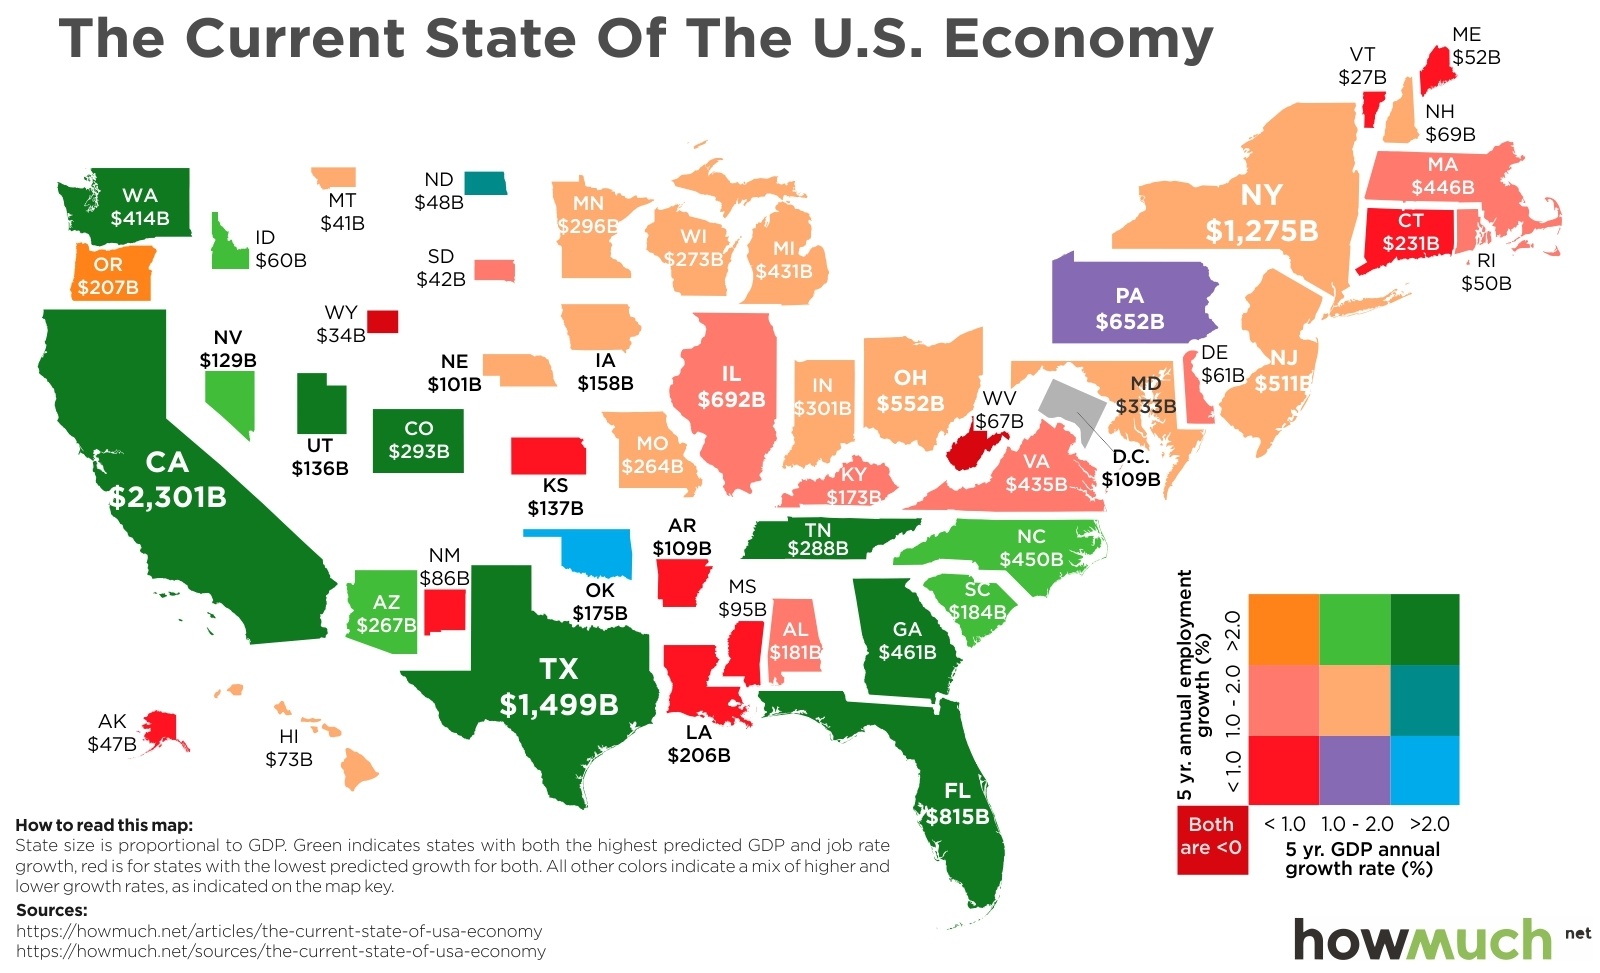
The Uneven Recovery from the Great Recession. Has your State Recovered?
April 3rd, 2026
Personal Finance
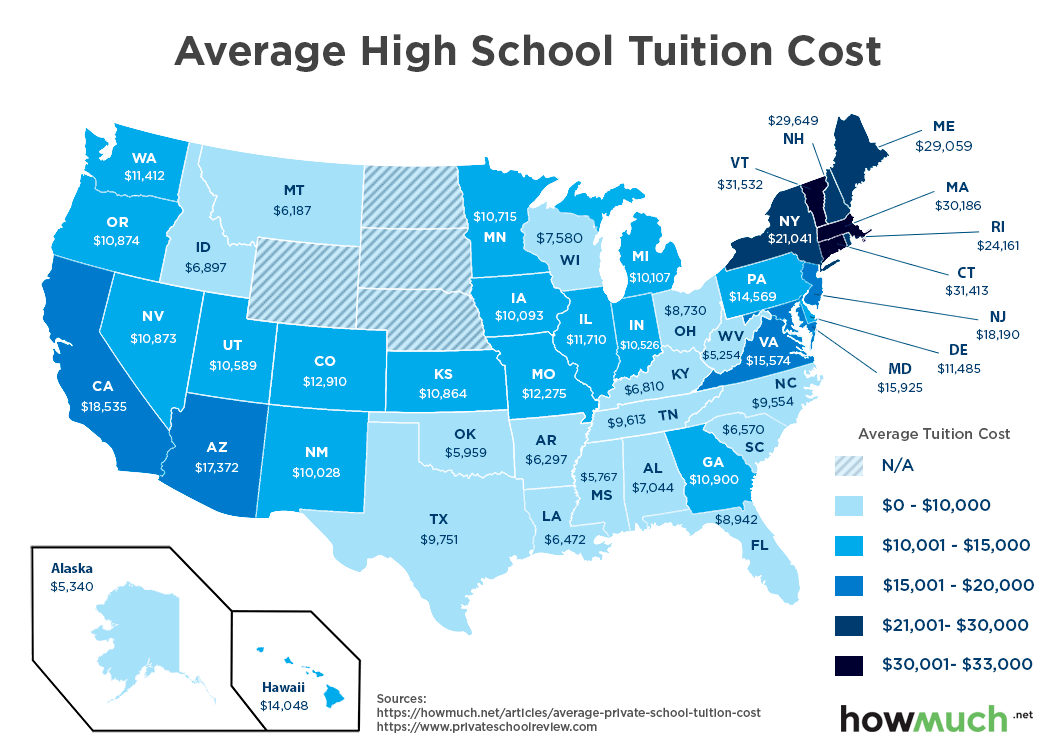
The average cost of private school tuition has grown at a rate that is higher than inflation over the past 20-years. While there are several cost increases that have led to the rise in private school tuition...

April 3rd, 2026
business
If you work for Apple, here's an extra reason to congratulate yourself: you – and each of your colleagues – generate on average $1.9 million in revenue for your company each year. That's more than employees at any other Tech company in the country.

April 3rd, 2026
Personal Finance
debt
College is the first and most important investment we will ever make, so choosing the right school is crucial. Find out how much debt you can expect to have after graduation and how much money you will end up making in the top 20 private and public universities

April 3rd, 2026
Wealth
The United States is known to have many millionaires and billionaires. But it turns out that not all states are equal when it comes to the rich and powerful...

April 3rd, 2026
Personal Finance
The most expensive average electricity bill by State is nearly double the least expensive and it's all because of the source used to generate electricity.

April 3rd, 2026
business
Ben & Jerry's, famously, is from Vermont. But did you know that 7-Eleven grew up in Texas? Check out the origins behind some of the best-known brands in the country on this map, which shows the most successful franchise business for each state.

April 3rd, 2026
Real Estate
Skyscrapers are viewed as a symbol of cultural expression, as new designs and spectacular heights define these enormous buildings. These architectural marvels are usually the work of collaboration, including investors, architects, and builders.