
May 20th, 2016
The Economy
Obama slashed spending in these categories, but did it go far enough?

May 12th, 2016
Business
Real Estate
Wealth
How deep should your wallet be to get the biggest and best houses in each state?
May 12th, 2016
The Economy
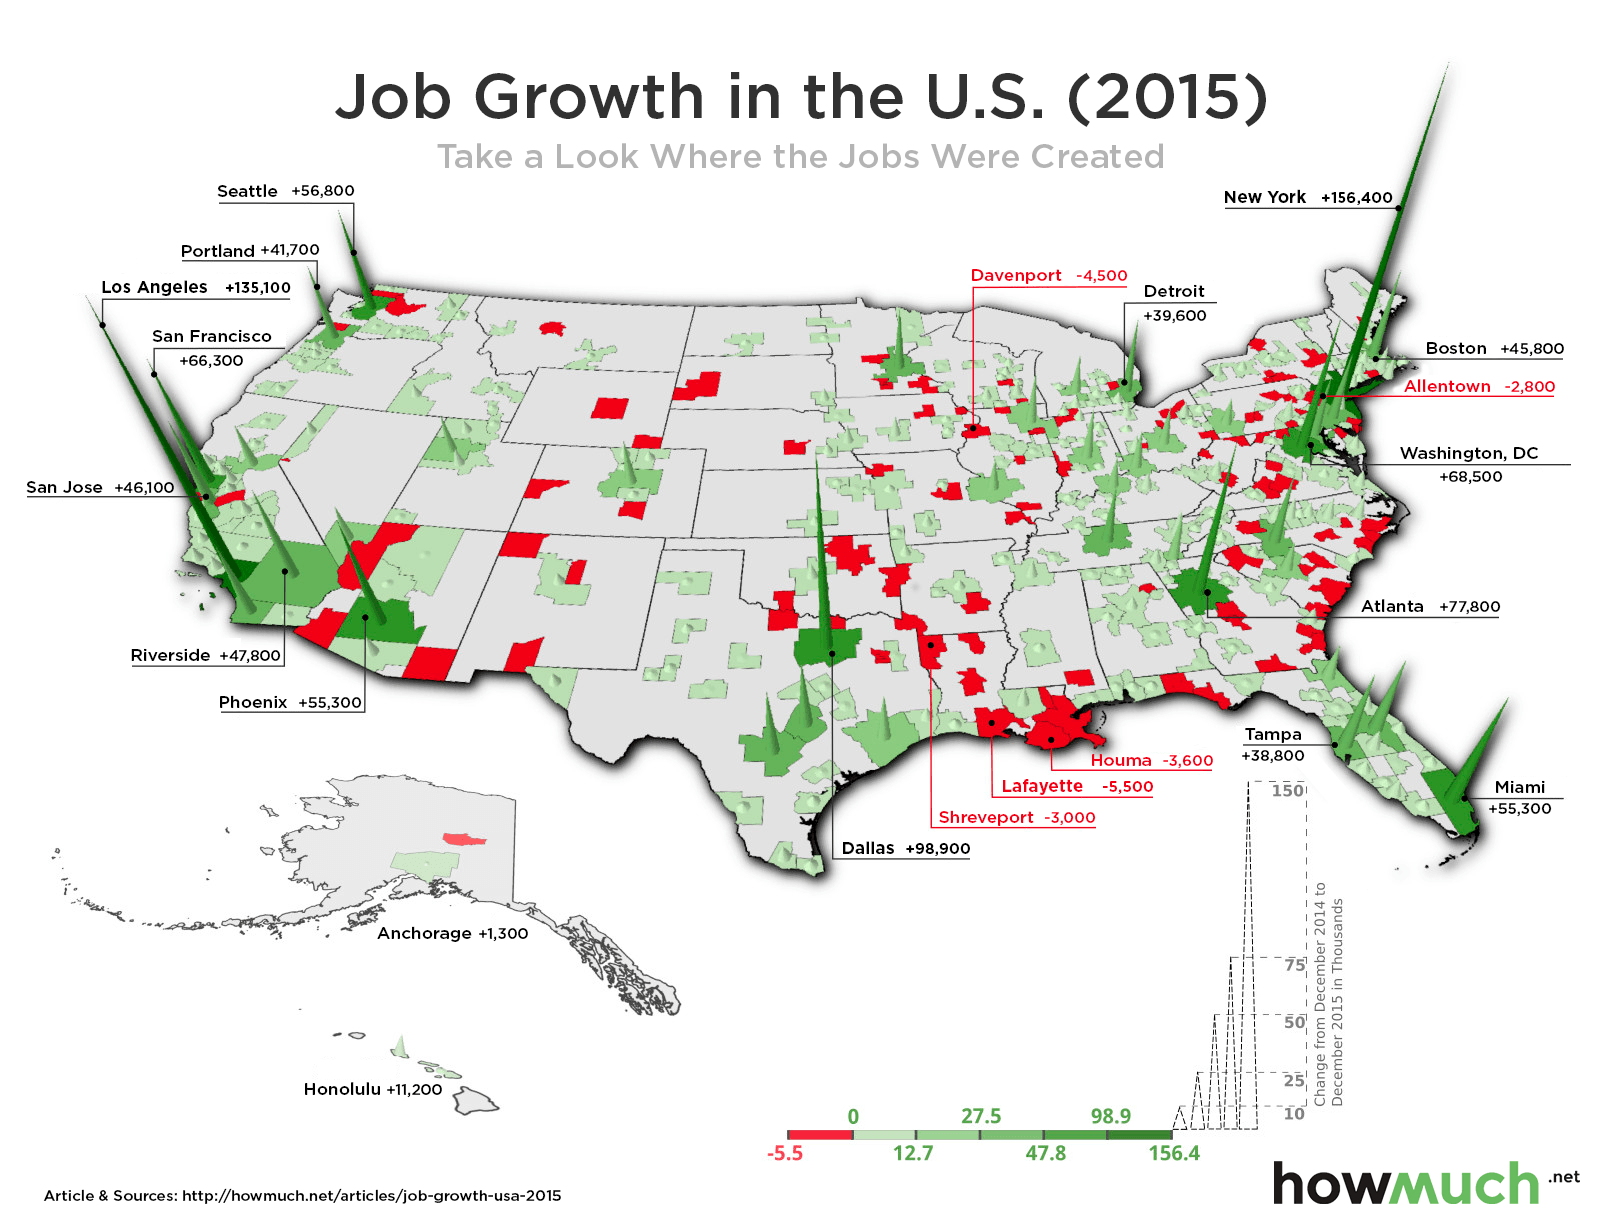
Jobs
Looking for a job? These U.S. cities may be your best bet.

May 12th, 2016
Personal Finance
Car owners may want to move to a different state after seeing this map.

May 5th, 2016
This GIF Shows (in Two Minutes) 30 Years of Market Prices for the 20 Biggest Brands Alive
April 22nd, 2016
This GIF Shows Where the U.S Imports Oil From in the Past 15 Years

April 21st, 2016
Business
David defeats Goliath in the race to the top of the electric car market.

April 14th, 2016
The Economy
Go East, young man, for the greatest economic growth.

April 14th, 2016
The Economy
This Voroni diagram represents the relative size of each country’s economy in terms of nominal GDP: the larger the area, the larger the size of the economy. The areas are further divided into three sectors: services, industrial, and agricultural.

April 14th, 2016
Personal Finance
Debt
A decade of rising education costs is hurting these states the most.