
April 3rd, 2026
Personal Finance
If you are a new parent putting your baby in childcare, you might be in for a shock. Childcare costs more (a lot more) than college in over half the states in the country.
April 3rd, 2026
Personal Finance
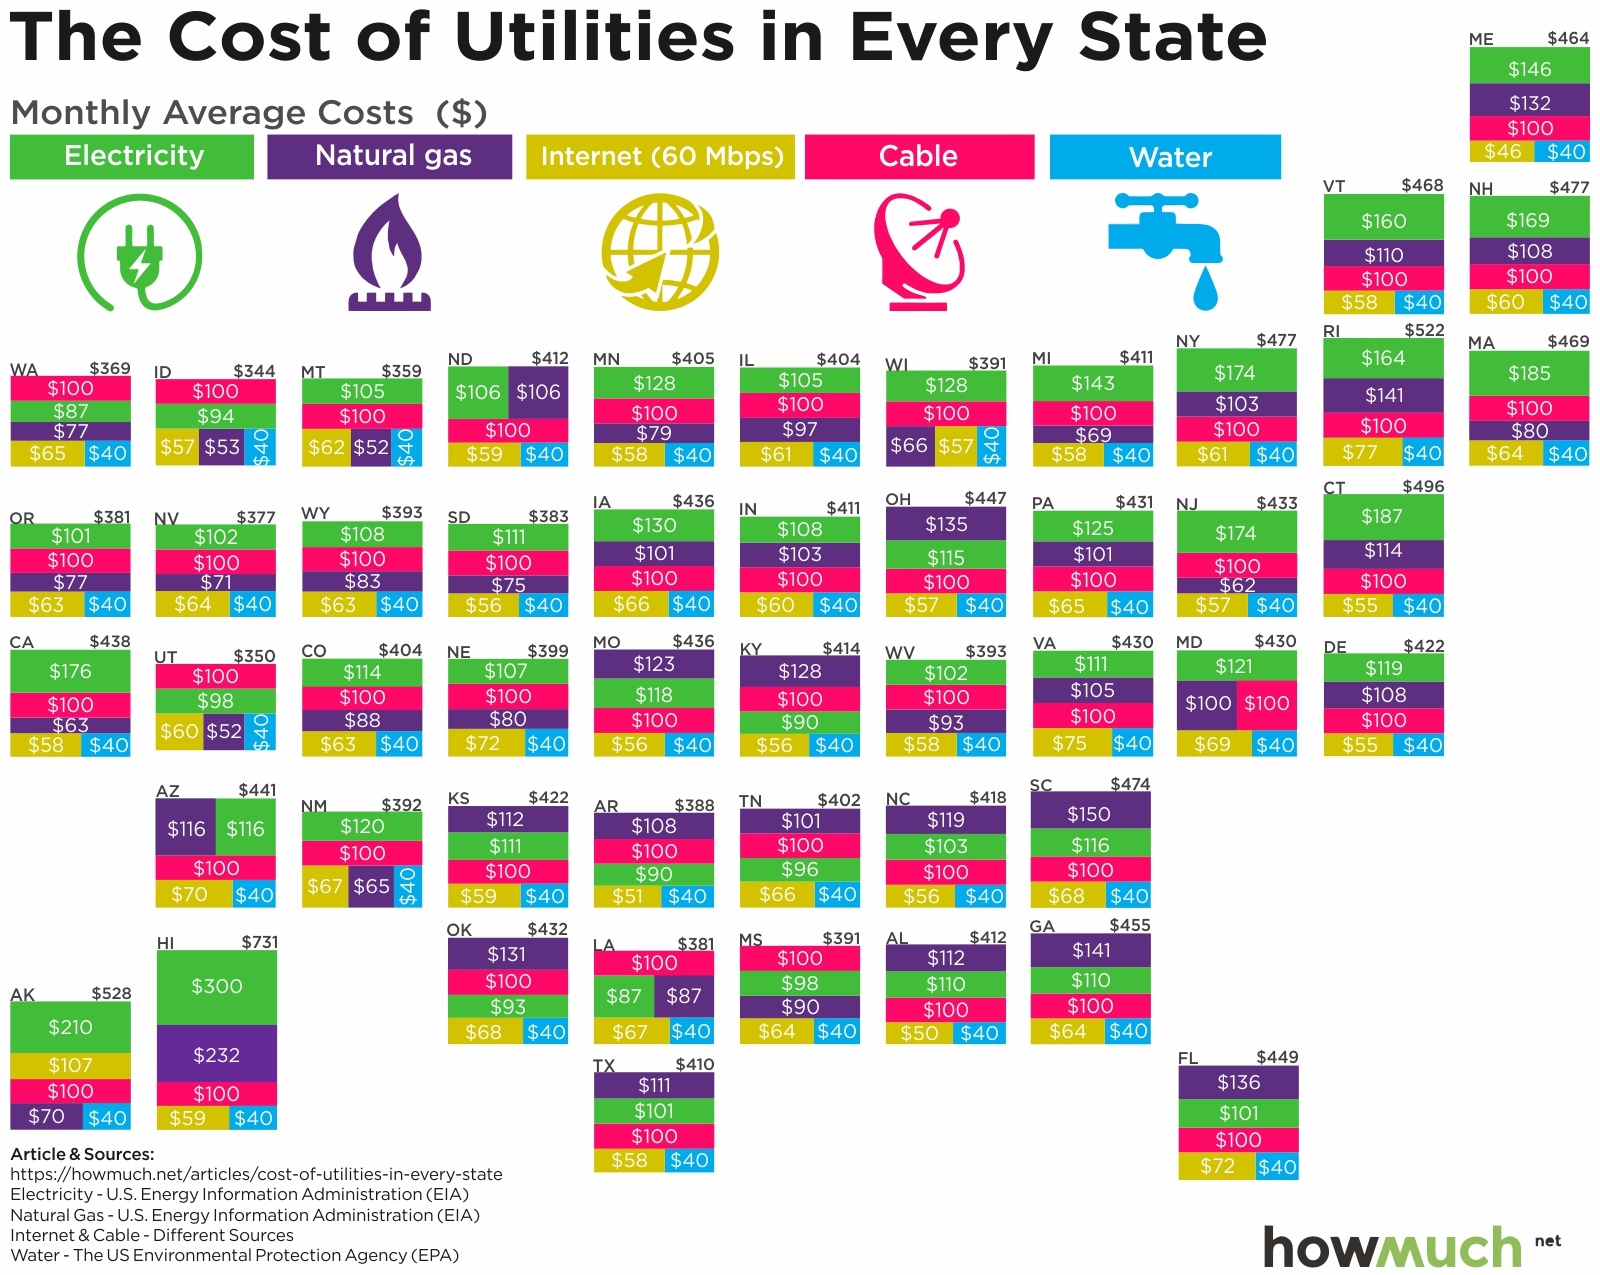
Unless you live off the grid, utilities are a big part of your monthly fixed budget. Our map breaks down how much Americans spend each month on electricity, gas, water, cable and Internet.
April 3rd, 2026
Personal Finance
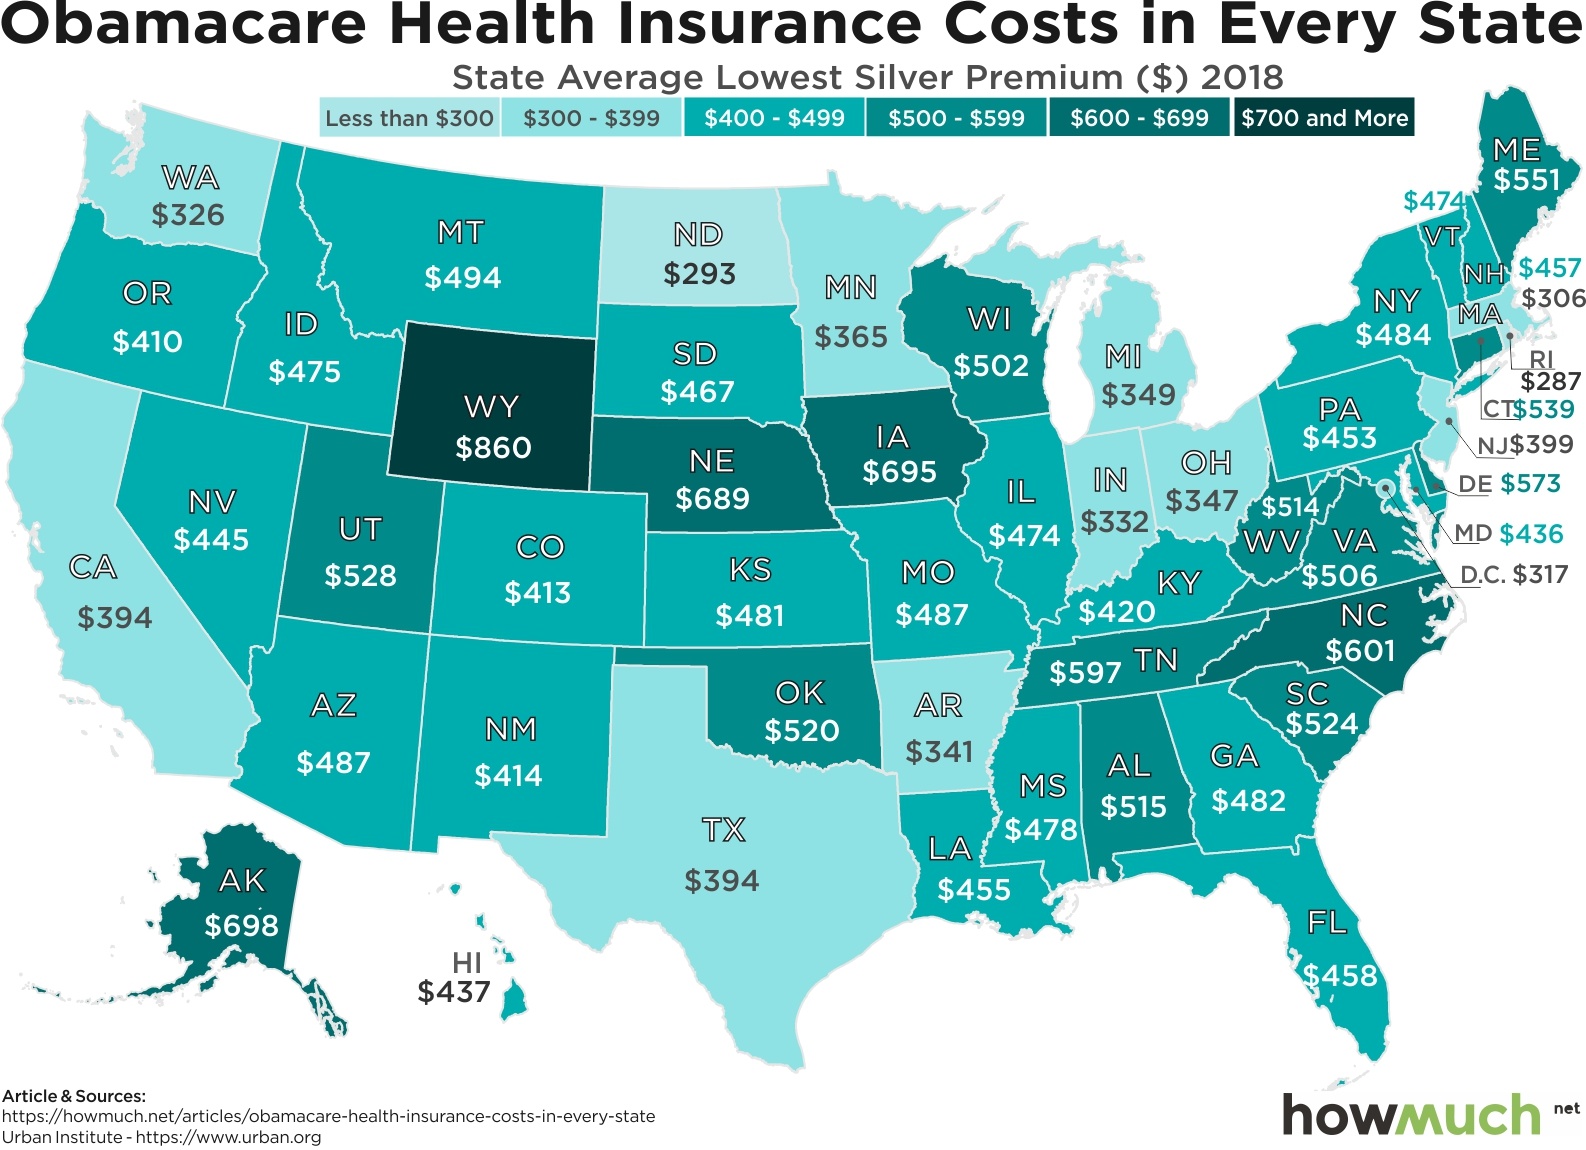
It’s time for open enrollment for Obamacare, and lots of people are in for a big price shock. Our map breaks down which states have the worst rates in the country for basic silver and gold insurance plans.

April 3rd, 2026
Wealth
What if we told you that a little over 2,000 people control $9 trillion in wealth? Our map helps you visualize both the geography of where billionaires live and the size of their fortunes.

April 3rd, 2026
Personal Finance
One of the best ways to save money is by switching car insurance companies, but how much should you really be paying for full coverage? Our map breaks down the market for auto insurance in every state across the country.

April 3rd, 2026
Wealth
The scale of wealth inequality around the world is just astonishing. Our series of new maps show how people living in the West are on average over 1,000 times richer than people in the poorest parts of Africa.
April 3rd, 2026
Personal Finance
The Economy
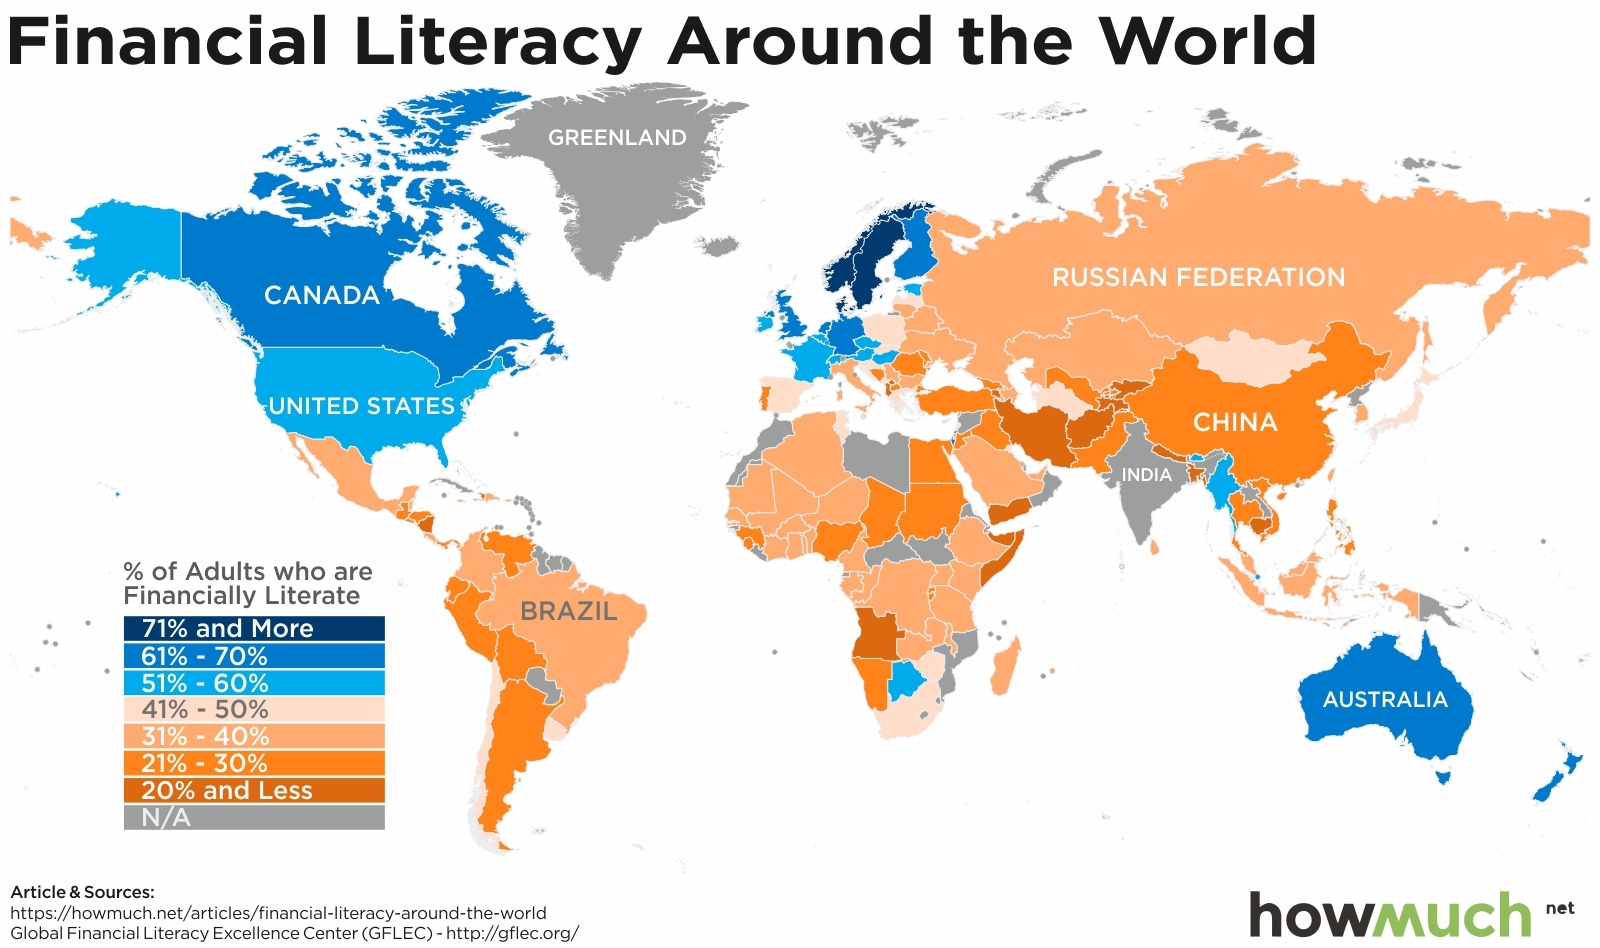
Being financially literate means you understand basic concepts like diversification, inflation and compound interest. Our series of maps indicate relatively few people around the world do.

April 3rd, 2026
The Economy
social-issues
Our visualization explores relationship between public perceptions of fairness and the size of every country’s economy

April 3rd, 2026
Personal Finance
The Economy
Is the American Dream over? Our visualization breaks down the obscene levels of income inequality between the disappearing middle class and everyone else

April 3rd, 2026
jobs
Is the U.S. economy at full employment? Our new map highlights the city with the highest levels of job growth for each state in the country. The economic recovery depends entirely on living in the right place.