
April 3rd, 2026
The Economy
social-issues
Income inequality is once again a hot button political issue, but how pervasive is the problem? Our new map highlights the metro areas with the highest and lowest income ratios between the top 1% of earners and everyone else.

April 3rd, 2026
Personal Finance
social-issues
Regardless of which state you live in, the top 1% of wage earners bring home substantially more money than the bottom 99%. Our new work explores the geography of income inequality across the US.

April 3rd, 2026
Personal Finance
Real Estate
The housing market has recovered, and median worker pay just reached an all-time high. Our new map highlights how much money you need to make in the 50 largest American cities to afford a typical house
April 3rd, 2026
The Economy
trade
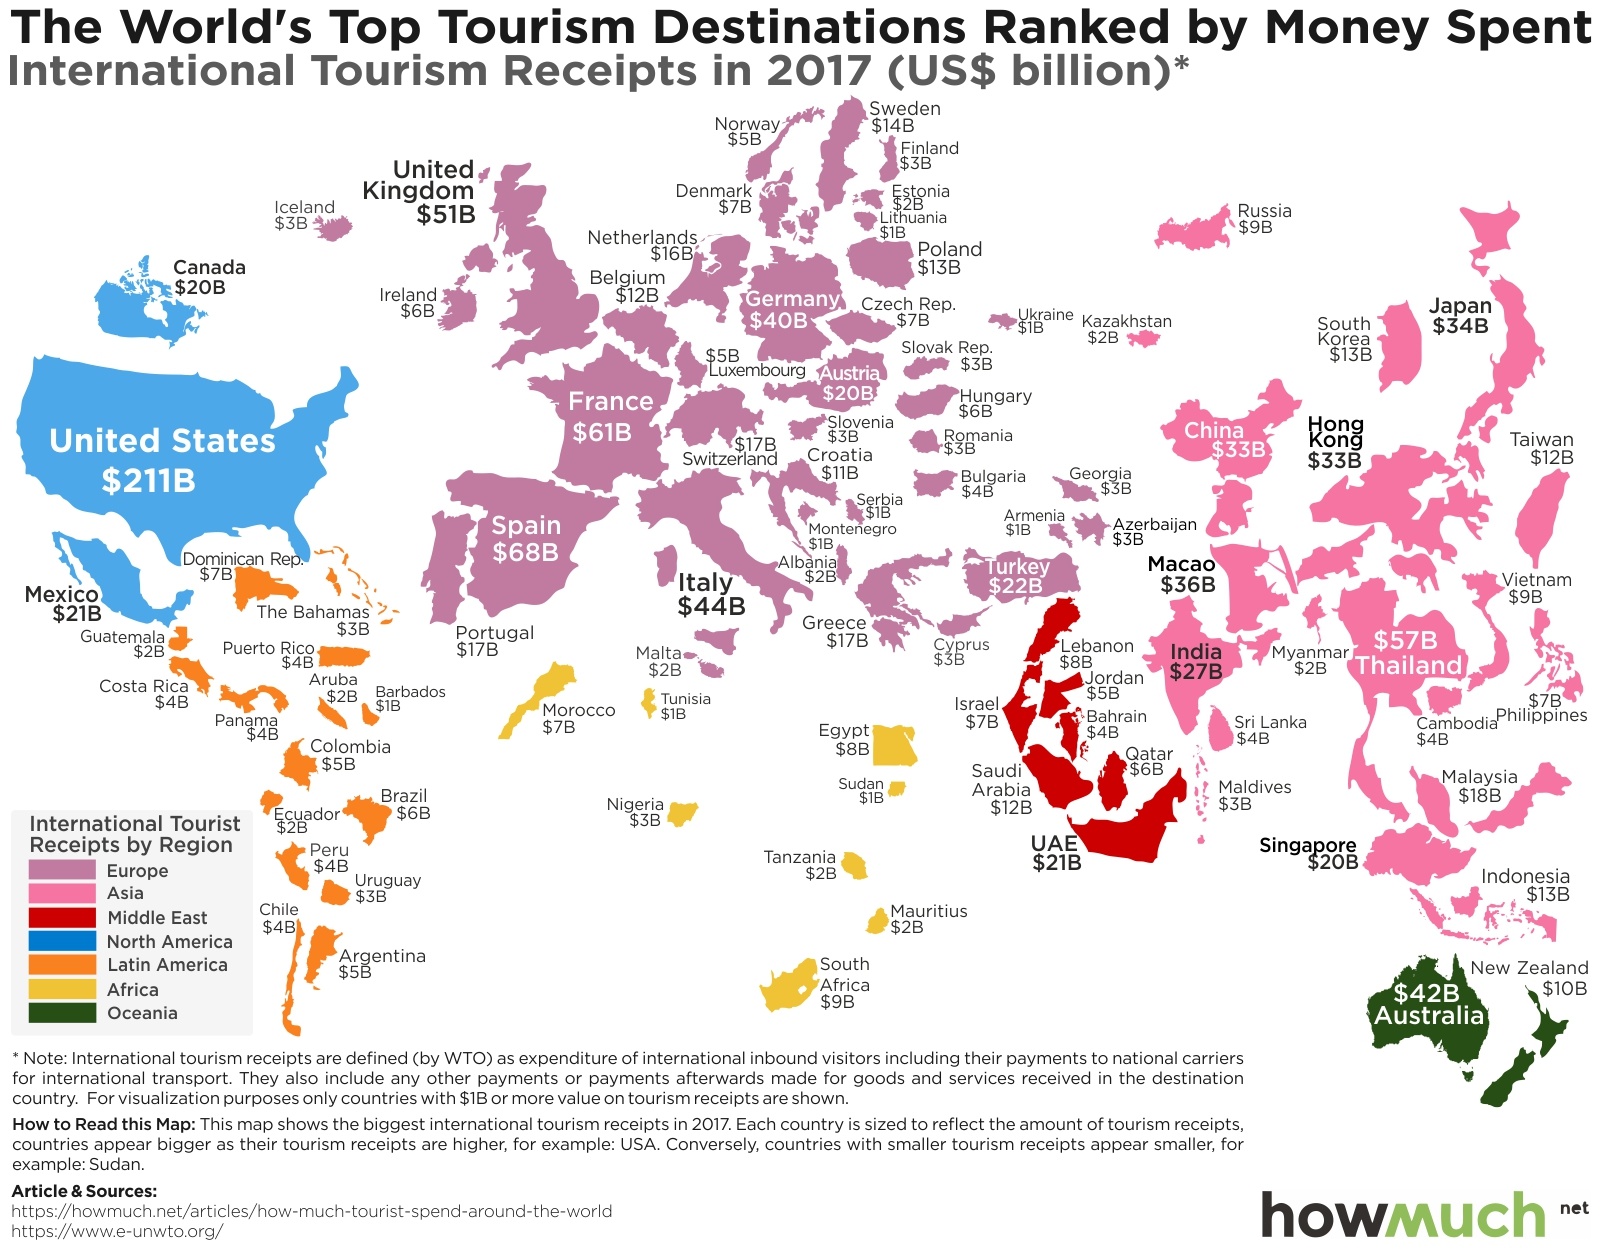
Tourism is a big part of the global economy, but the industry’s size varies dramatically between countries and across continents. Our newest map provides a snapshot of how much money each countries generates from international tourism.

April 3rd, 2026
Personal Finance
taxes
Trump’s tax cut is in full force and Republicans are trying to make it permanent, but is it affecting everyone equally? An often-overlooked aspect of taxation is geography—where you live determines a lot about your total tax burden.

April 3rd, 2026
The Economy
cryptocurrencies
Bitcoin is in a slump, but if you take the long view, its value is still significantly higher than a year ago. In fact, the entire cryptocurrency market is now worth billions more than Jeff Bezos and Bill Gates

April 3rd, 2026
The Economy
social-issues
Natural disasters are always in the news, but do you know which ones end up causing the most damage? Our newest visualization explores the cumulative damage of natural disasters across the U.S. since 1980.
April 3rd, 2026
social-issues
jobs
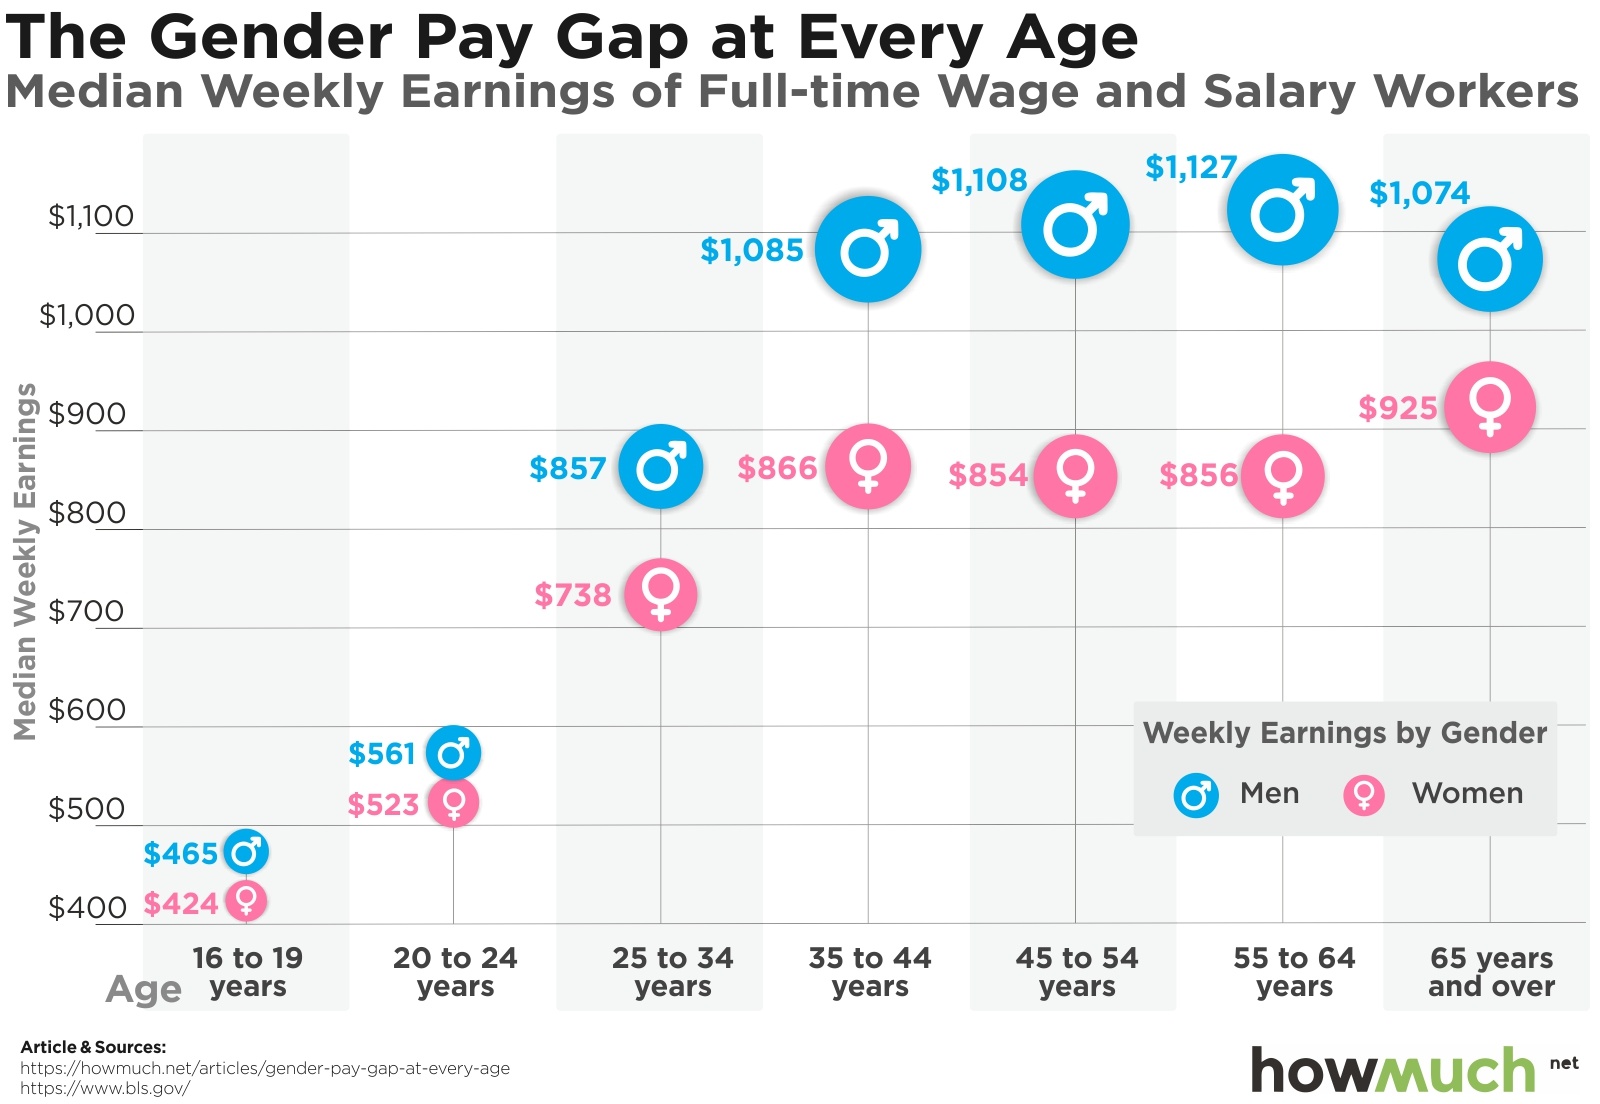
Why do men earn more money than women? Economists debate the reasons behind the gender pay gap, but our new visualization highlights the undoubtable fact that it exists for workers at every age.

April 3rd, 2026
Personal Finance
There is a giant hole in the safety net.Our visualization highlights the enormous difference between what social security pays out and the average living expenses in every state.
April 3rd, 2026
jobs
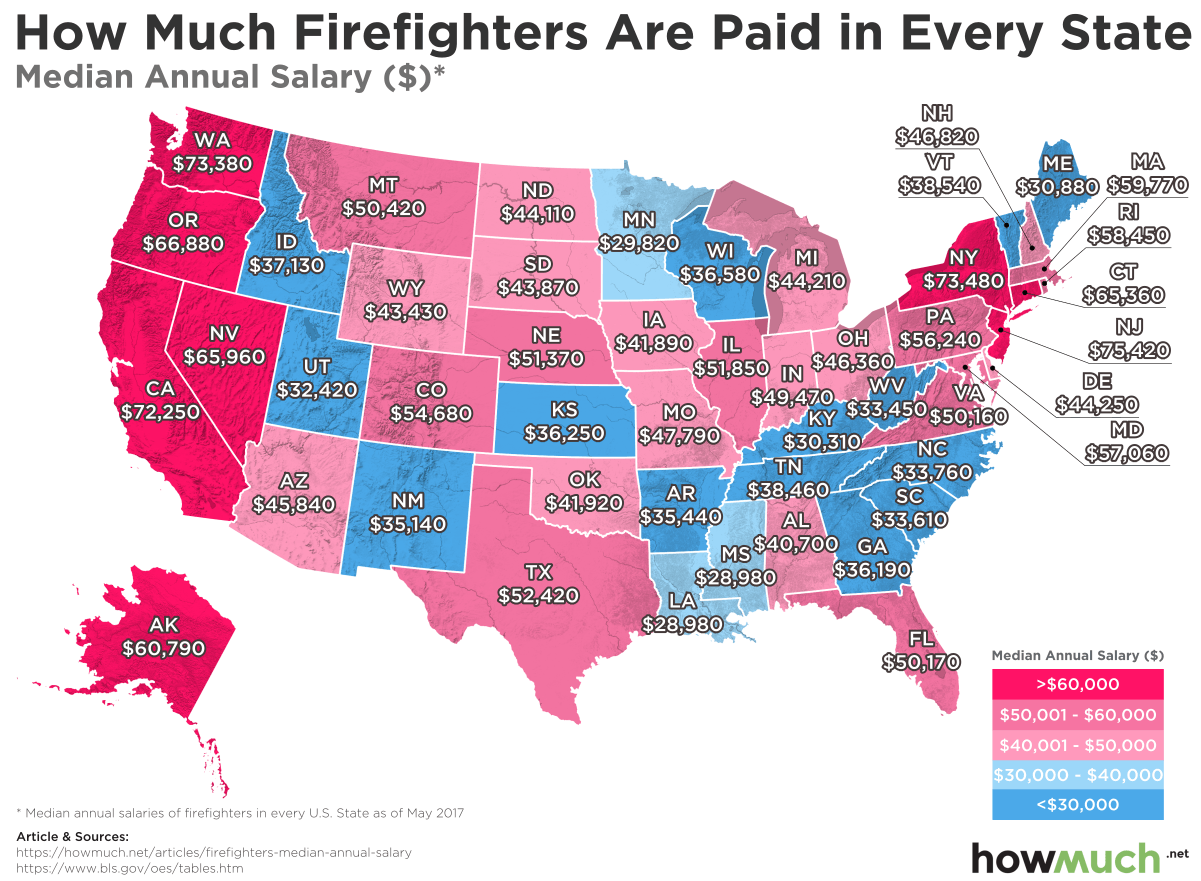
Firefighters risk their lives for the public, but how much money should they make? Our latest map breaks down median firefighter salaries on a state-by-state basis, highlighting the places where they barely earn above the poverty line.